
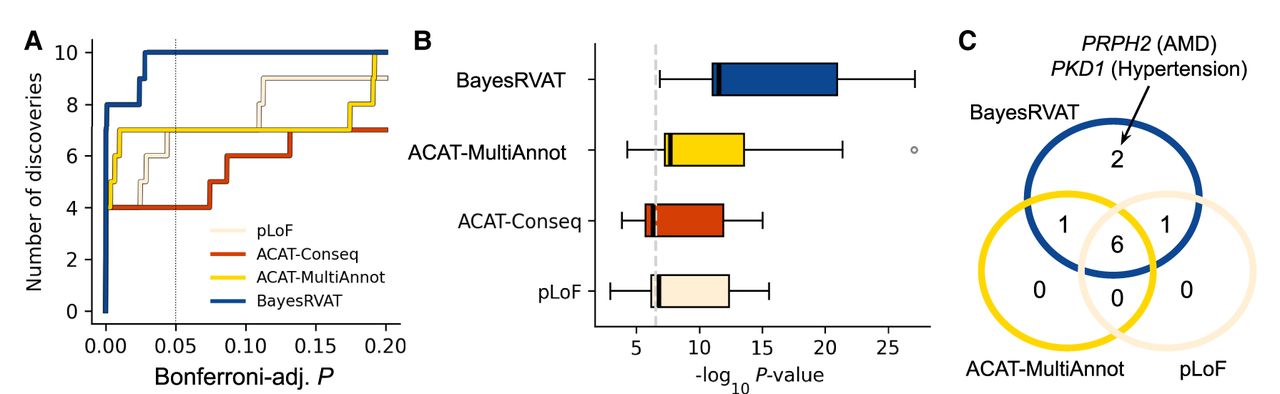
BayesRVAT outperforms alternative burden tests in disease trait analyses. (A) Step function showing the cumulative number of significant gene–trait associations as a function of Bonferroni-adjusted P. BayesRVAT (blue) consistently identifies more associations than pLoF (beige), ACAT-Conseq (red), and ACAT-MultiAnnot (yellow) across all thresholds. (B) Distribution of P-values for the nine significant associations identified across all methods (Bonferroni-adjusted P < 0.05 for at least one method). (C) Venn diagram illustrating the overlap of significant gene–trait associations detected by each method. BayesRVAT recovers all signals found by other methods and uniquely identifies associations between PKD1 and hypertension, and between PRPH2 and AMD and other retinal diseases.


