
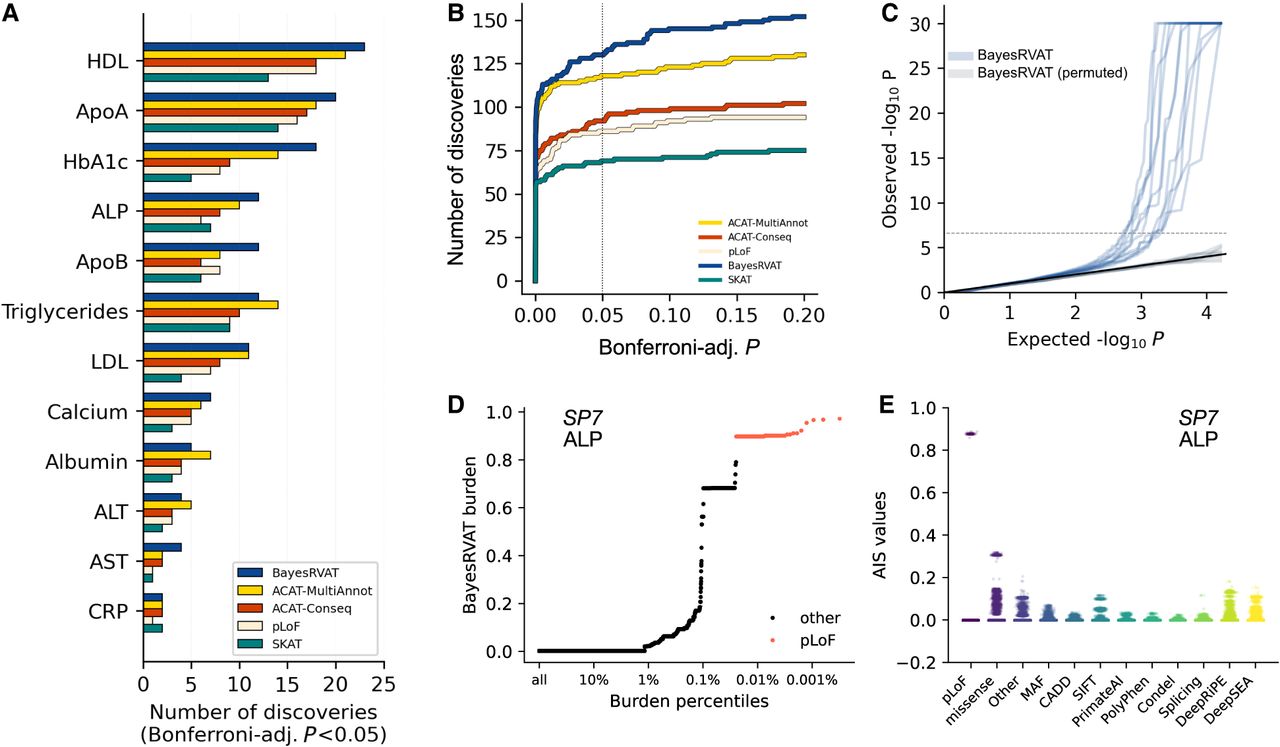
Analysis of blood biomarkers in the UK Biobank. (A) Number of significant gene–trait associations (Bonferroni-adjusted P < 5 × 10⁻²) discovered by BayesRVAT, ACAT-MultiAnnot, ACAT-Conseq, and pLoF burden tests for each analyzed blood trait. (B) Cumulative number of discoveries at varying Bonferroni-adjusted significance thresholds. (C) QQ plot showing the distribution of P-values from BayesRVAT in real data and under a null with permuted genotype data, confirming well-calibrated P-values. (D) Burden scores learned by BayesRVAT for SP7 and ALP across burden percentiles, showing individuals carrying pLoF mutations in red. (E) Annotation importance scores (AIS) from BayesRVAT for the association between SP7 and ALP, which highlights contributions from missense, DeepRiPE, and DeepSEA annotations.


