
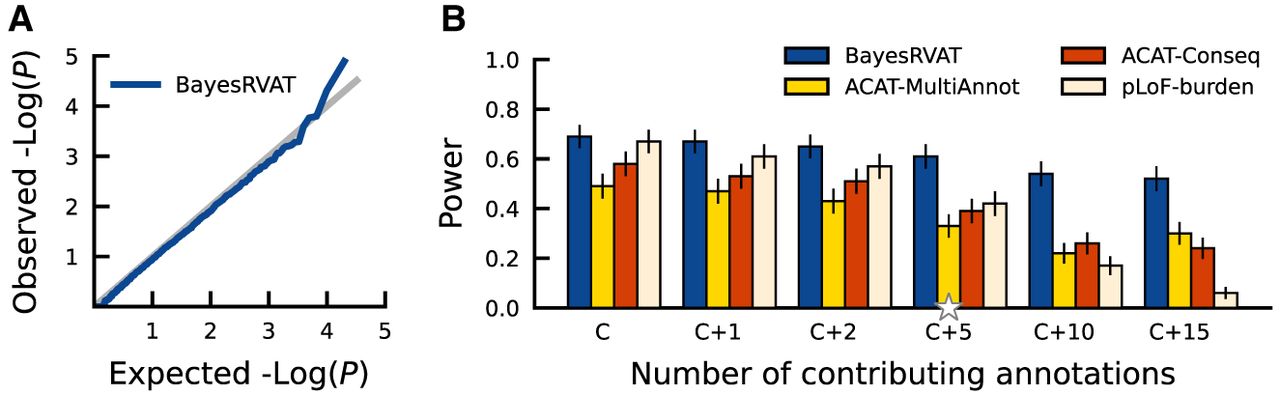
Evaluation of calibration and power in BayesRVAT using synthetic data. (A) QQ plot assessing the calibration of P-values from BayesRVAT on synthetic data generated under the null model with no genetic effects. (B) Statistical power comparison between BayesRVAT, ACAT-MultiAnnot, ACAT-Conseq, and pLoF-burden test, across varying numbers of contributing continuous annotations: simulating only effects from pLoF and missense consequences (C), and considering additional effects from 1 (C+1), 2 (C+2), 5 (C+5), 10 (C+10), and 15 continuous annotations (C+15) (Methods). Power is measured at the exome-wide significance threshold of P < 2.5 × 10⁻⁶, computed over 100 replicates for each scenario. Stars on the x-axis indicate default parameter values, which were held constant when varying other parameters.


