
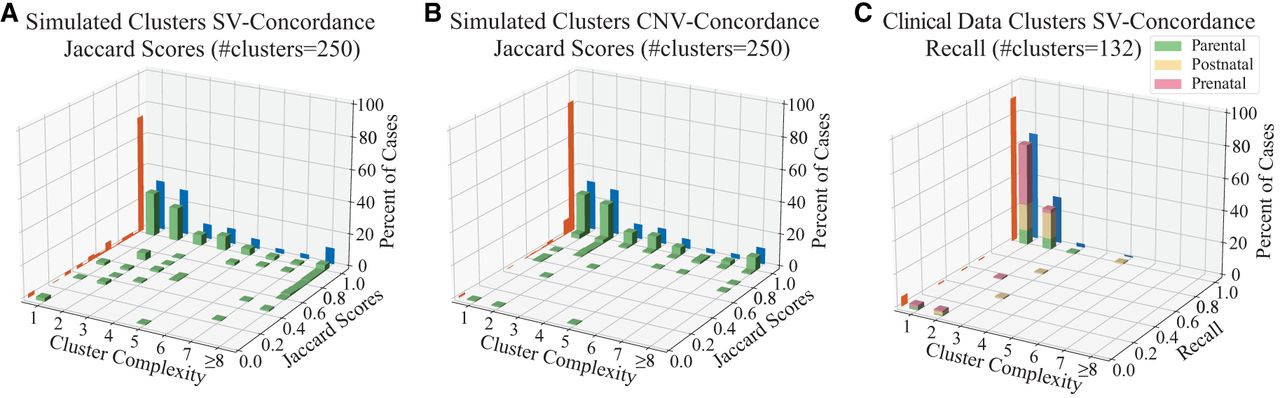
Validation statistics on simulated and clinical karyotypes. Each plot displays a 3D histogram of Jaccard score (or recall) of clusters in the sample group. The three axes separate clusters based on complexity, frequency of observations, and Jaccard score or recall. The frequencies of specific Jaccard scores are displayed in the orange projection, showing that the vast majority of samples have a high Jaccard score or recall. The frequencies of cluster complexity are shown in blue and reveal that the cluster complexity of simulated cases is generally higher than the clinical data. (A) Jaccard score of SV edges in simulations; (B) Jaccard score of CNV calls in simulations; (C) recall of SV calls on 132 clusters from prenatal, postnatal, and parental clinical samples.


