
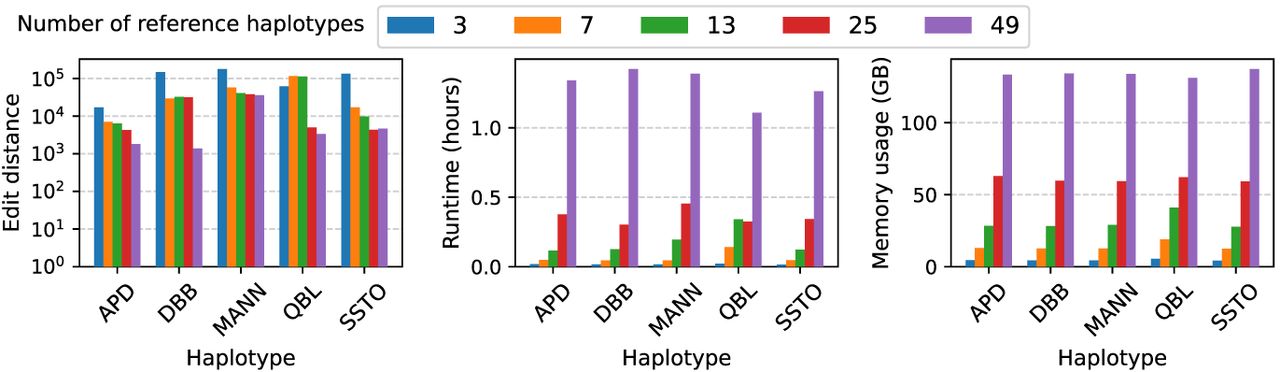
Figure 5.
Assessment of PHI's performance with the increasing number of genomes in pangenome graph. The left figure shows the accuracy in terms of edit distance between the output sequences and ground-truth sequences. The middle and right figures show the runtime and memory usage, respectively.


