
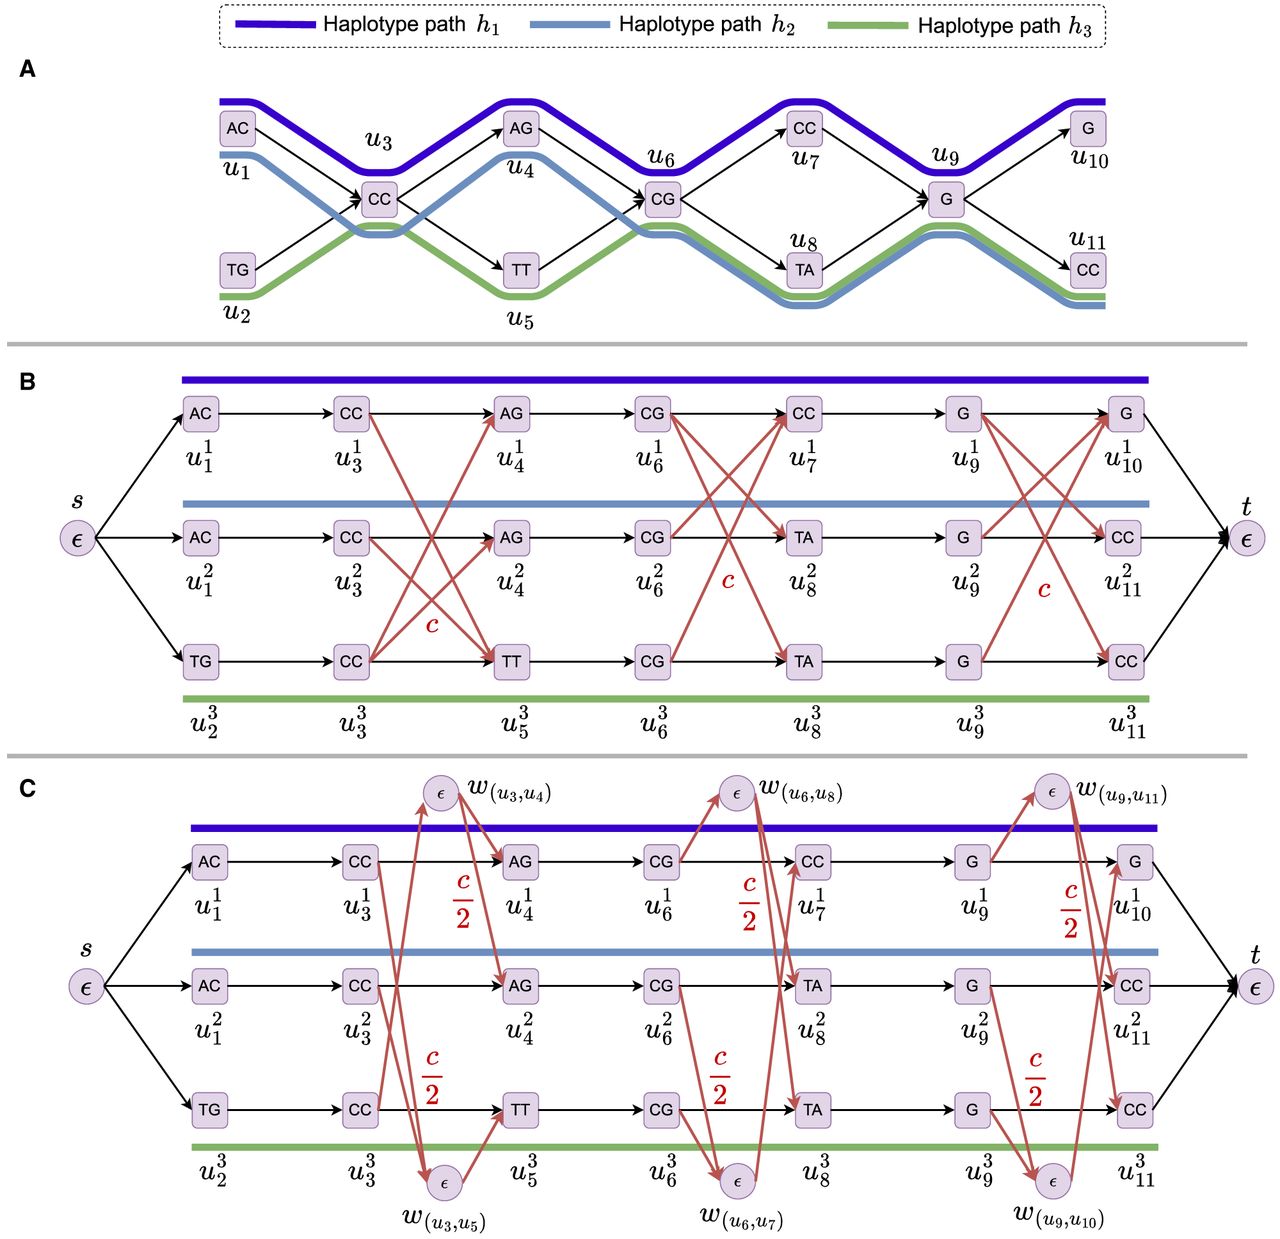
Figure 2.
Illustration of an expanded graph. (A) A pangenome graph with three haplotype paths: h1, h2, and h3. (B) The corresponding expanded graph, which includes three disjoint paths, one for each haplotype path. The recombination edges are shown in purple; these edges have a weight of c. We consider only the useful recombinations (Lemma 1). The edges that are not recombination edges in the expanded graph have a weight of 0. (C) The corresponding optimized expanded graph.


