
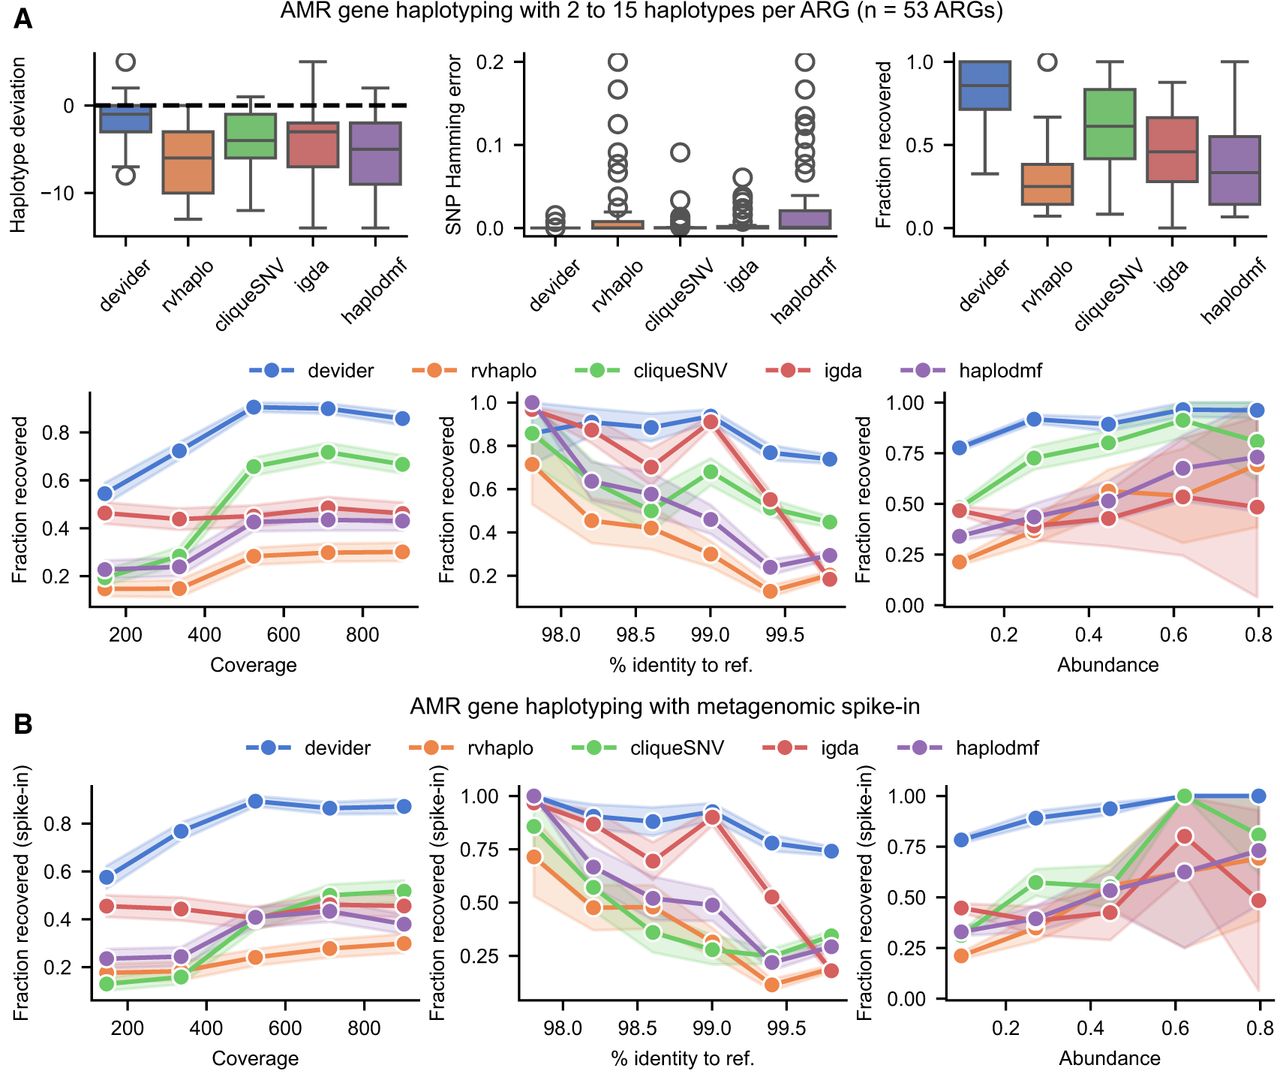
Benchmarking for haplotyping of synthetic mixtures of antimicrobial resistance (AMR) genes. (A, top) Results for 53 sets of AMR genes with two to 15 haplotypes and reads simulated at 80×–1000× coverage (95% identity; 1500 mean length), both picked uniformly at random. (Bottom) The same results but with fraction recovered as a function of the haplotype's coverage, its % nucleotide identity to the reference, and its abundance (i.e., normalized coverage). (B) Fraction recovered for the AMR genes after spiking the AMR reads into a synthetic long-read mouse gut metagenome from CAMI2. Each method was rerun after aligning the pooled data set against the AMR gene references. Error bars indicate standard errors after binning data points along the x-axis. Box plots show the median, the 25th and 75th percentiles, and 1.5× the interquartile range.


