
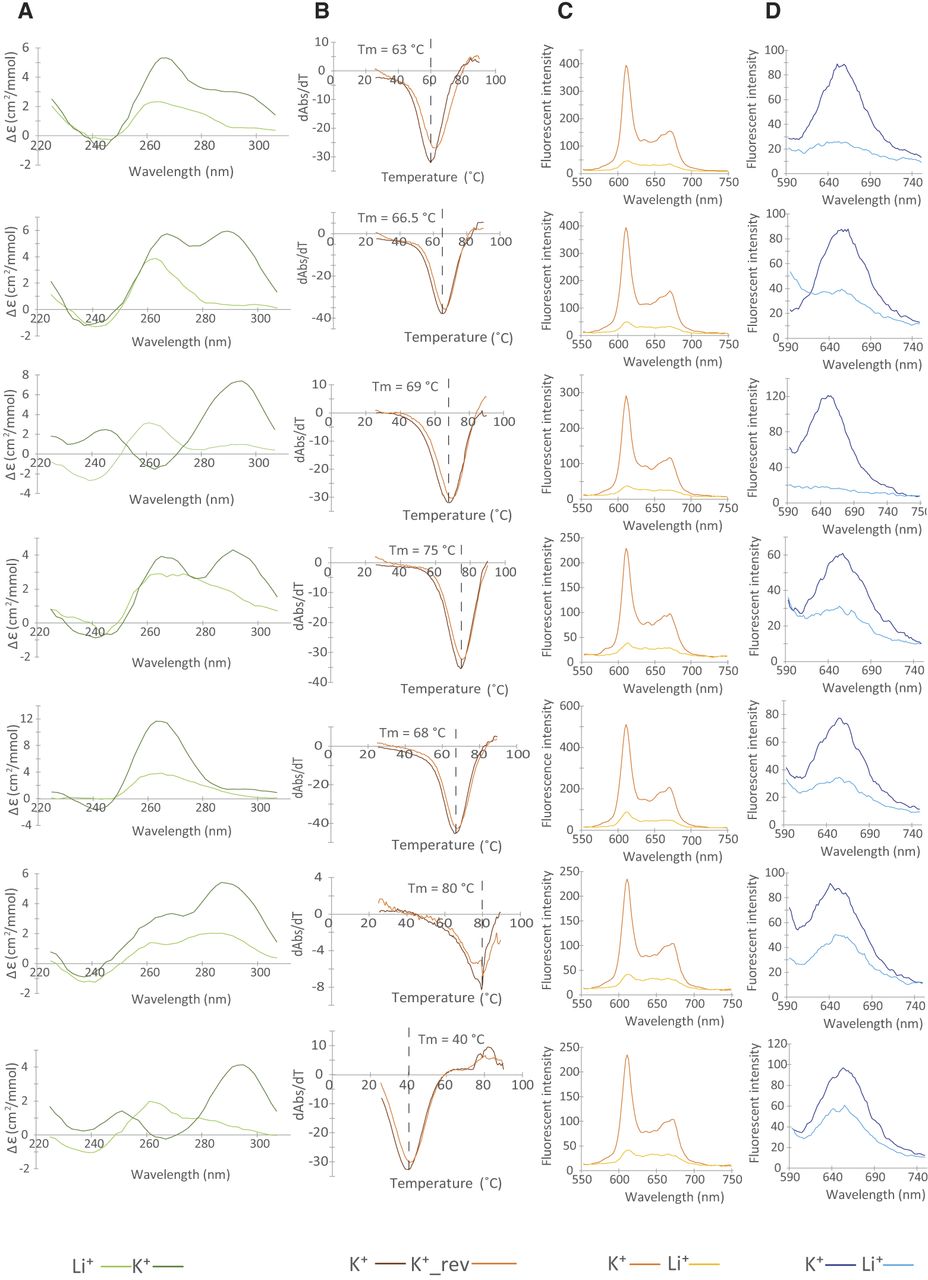
Experimentally validated G4 candidates. G4 ligand-induced G4 spectroscopic analysis reveals the G4 DNA structure formation in selected sequences from the dG4 database. (A) CD spectra in the presence of K+ and Li+. The overall higher signals under K+ conditions verify the presence of dG4 in all sequences. The positive and negative peaks at different wavelengths suggest different topologies were formed in different sequences, including parallel (negative peak at 240 nm, positive peak at 260 nm), antiparallel (negative peak at 240 nm, positive peaks at 240 nm and 295 nm), and hybrid (negative peak at 240 nm, positive peaks at 260 nm and 295 nm) topologies. (B) UV melting spectra in the presence of K+. The hypochromic shift observed at a wavelength of 295 nm is consistent with the presence of dG4 structures, with the melting temperature determined as the maximum negative value of the hypochromic shift. (C,D) NMM (C) and ISCH-oa1 (D) enhanced fluorescence spectroscopy in the presence of K+ and Li+. The fluorescence intensity is reported in units of hundreds. The higher fluorescent signals under K+ conditions illustrate the dG4 structure formation in all sequences.


