
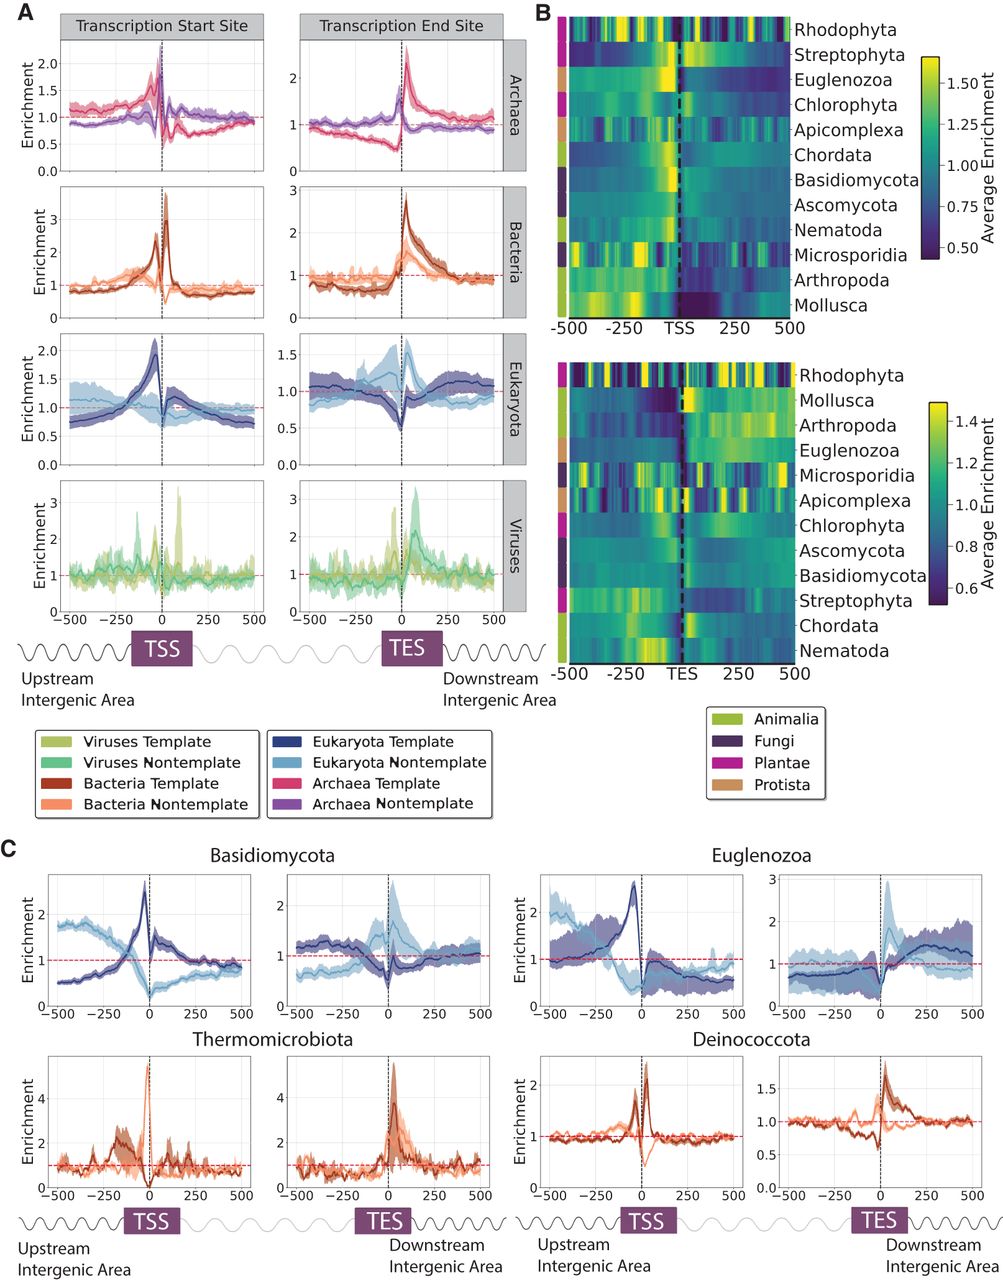
The topography of G4s relative to transcription start sites (TSSs) and transcription end sites (TESs) across the tree of life. (A) G4 distribution across the three domains of life and viruses. Results are shown for the template and nontemplate strands separately. (B) Distribution of G4s relative to TSSs and TESs across eukaryotic phyla. (C) G4 distribution relative to TSSs and TESs for two eukaryotic phyla, Basidiomycota and Euglenozoa, and two bacterial phyla, Thermomicrobiota and Deinococcota. Results are shown for the template and nontemplate strands separately. Error bars represent the 2.5% lowest and 97.5% highest percentile from Monte-Carlo simulations with replacement (N = 1000).


