
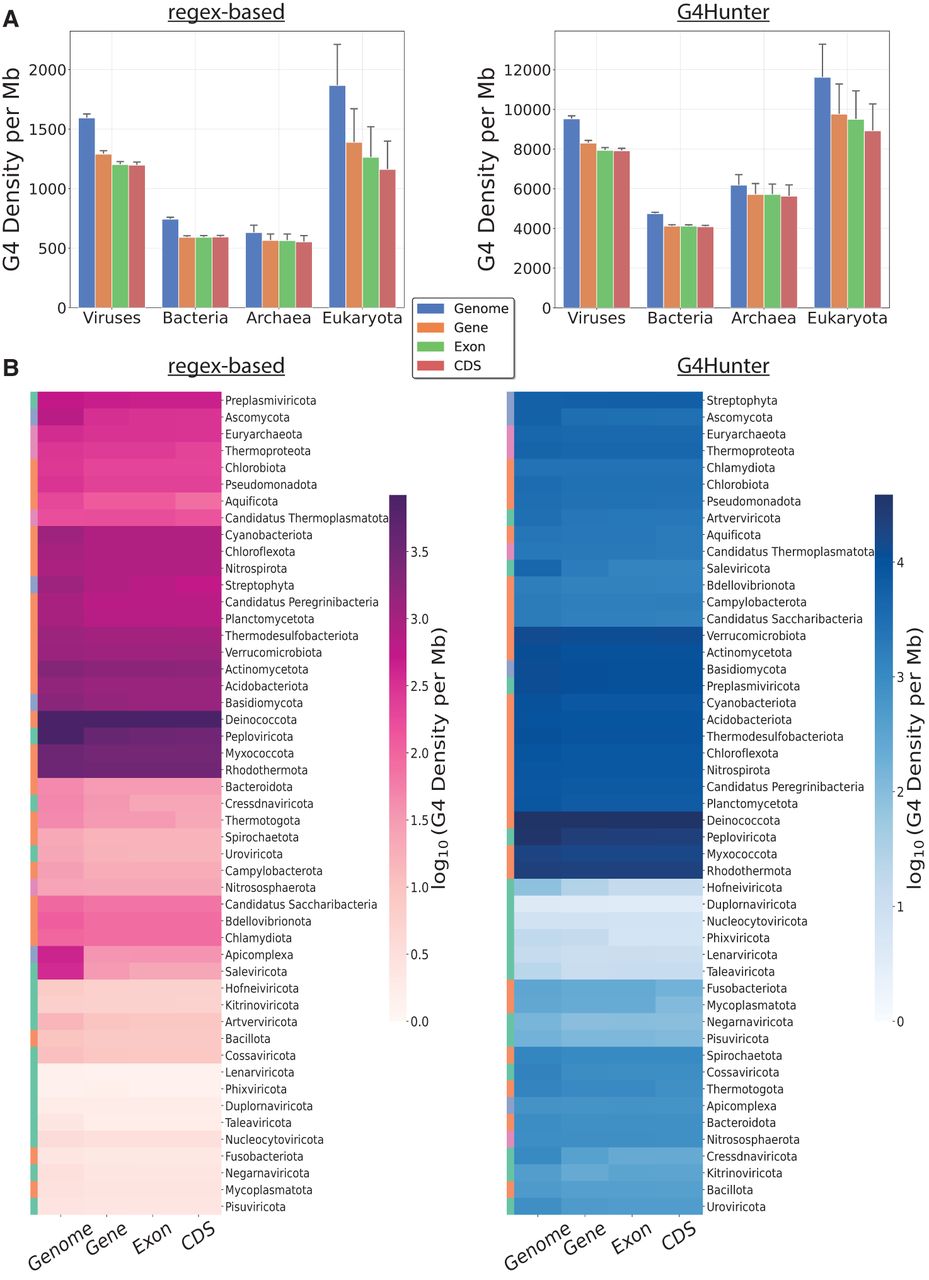
Figure 3.
G4 motif density in different genomic subcompartments for organisms across the tree of life. (A) Average G4 motif density (per million bases) in genome-wide, genic, exonic, and coding regions, categorized by the taxonomic subdivision among the three domains of life and viruses to which the organism belongs. (B) Average G4 motif density (per million bases) in genome-wide, genic, exonic and coding regions, for organisms belonging to different phyla. The colorbar is represented in the log10 scale. The subplots in A and B represent results based on G4s from G4Hunter (left) and the regex-based (right) algorithms.


