
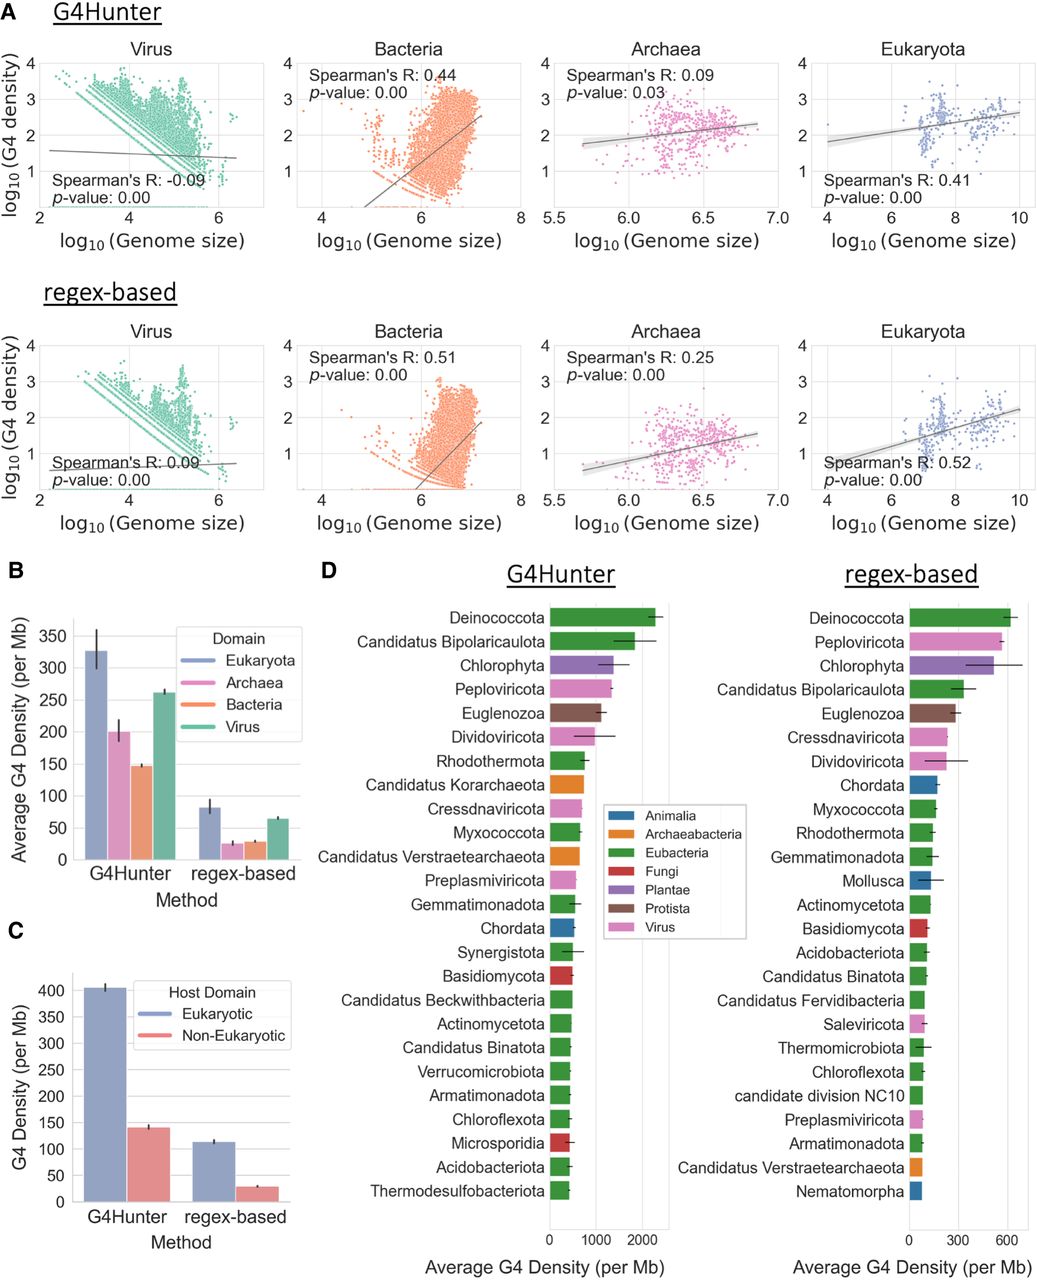
Taxonomic characterization of G4s across the tree of life. (A) Association between genome size and average G4 motif density (per million bases), categorized by the taxonomic subdivision among the three domains of life and viruses to which the organism belongs. Each dot represents an organismal genome, and the lines in each subplot represent the regression line for the respective associations. Values on both axes are represented in log10 scale. The subplots are based on G4s from G4Hunter (top row) and from the regex-based algorithm (bottom row). (B) Average density of G4s (per million bases) for organisms belonging to each domain of life and viruses. The error bars represent 95% confidence intervals. (C) Average density of G4s (per million bases) for viral genomes, categorized by their host domain (eukaryotic or prokaryotic). The error bars represent 95% confidence intervals. (D) Average density of G4s (per million bases) of organisms belonging to each phylum, based on G4s from G4Hunter (left) and G4 motifs detected using the regex-based algorithm (right). The plots include the top 25 phyla having the highest average G4 motif densities. The error bars represent SEM.


