
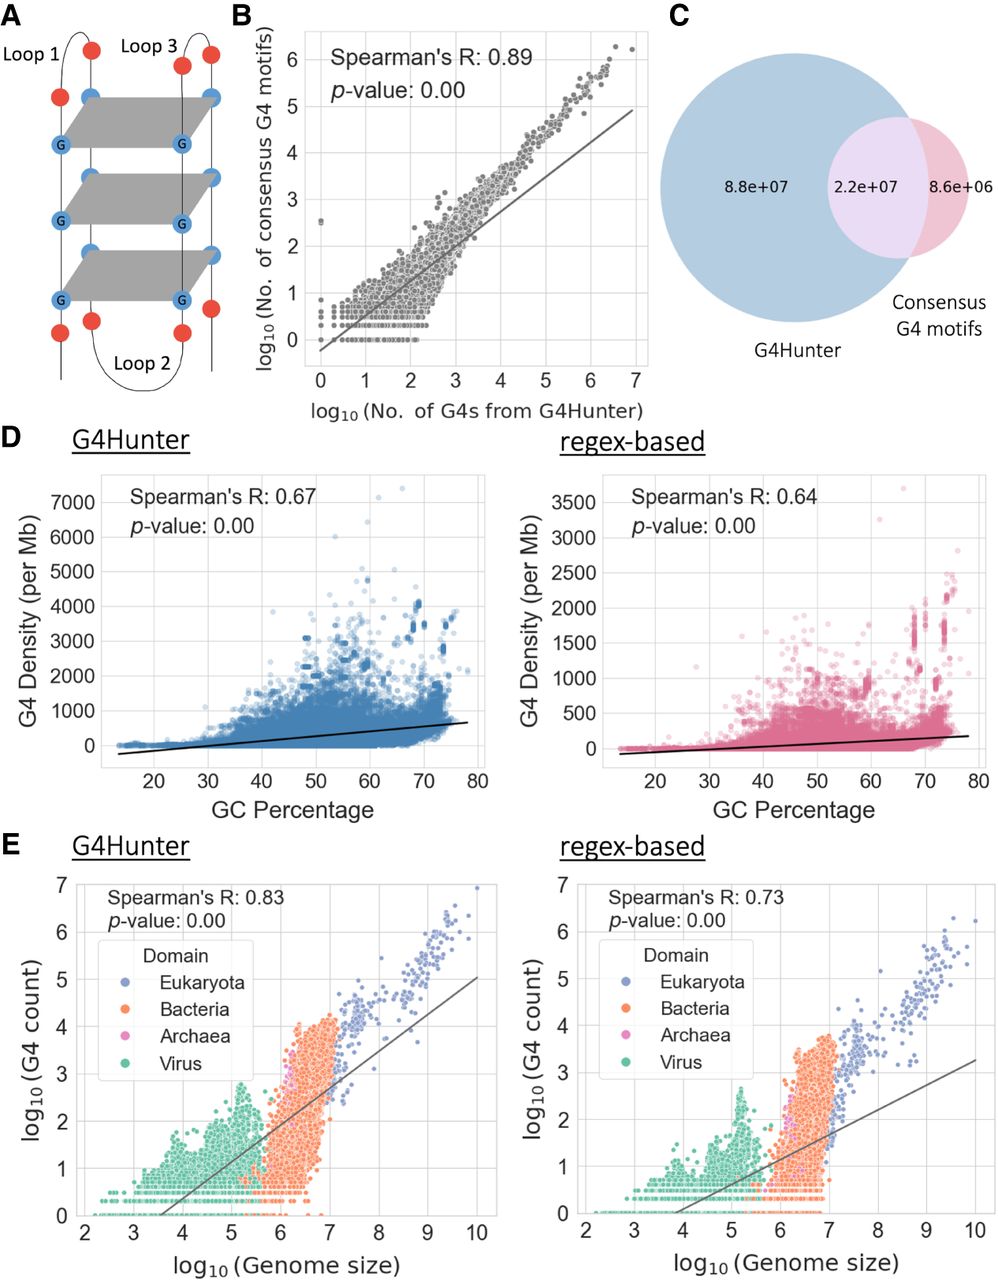
Characterization of G-quadruplexes (G4s) across 108,534 genomes. (A) Schematic illustration of a G4. (B) Scatter plot displaying the association between the number of G4s detected per species using G4Hunter (x-axis) and the regex-based (y-axis) algorithms. Values on both axes are represented in log10 scale. (C) Venn diagram showing the number of shared G4s found by the two methods. The blue circle represents the total number of G4s detected across all species using the G4Hunter method; the red circle represents the total number of G4 motifs detected using the regex-based algorithm across all species; and the overlapping purple region represents the G4s found using both methods. (D) Association between GC percentage and the number of G4s observed per million base pairs in each genome, based on G4s from G4Hunter (left) and G4 motifs detected from the regex-based algorithm (right). (E) Association between the length of the genome and the number of G4s detected, based on G4s from G4Hunter (left) and G4 motifs obtained from the regex-based algorithm (right). Values on both axes are represented in log10 scale. Each dot represents an organismal genome, and the color represents the taxonomic subdivision among the three domains of life and viruses that the organism belongs to. The lines in B, D, and E represent regression lines for the respective associations.


