
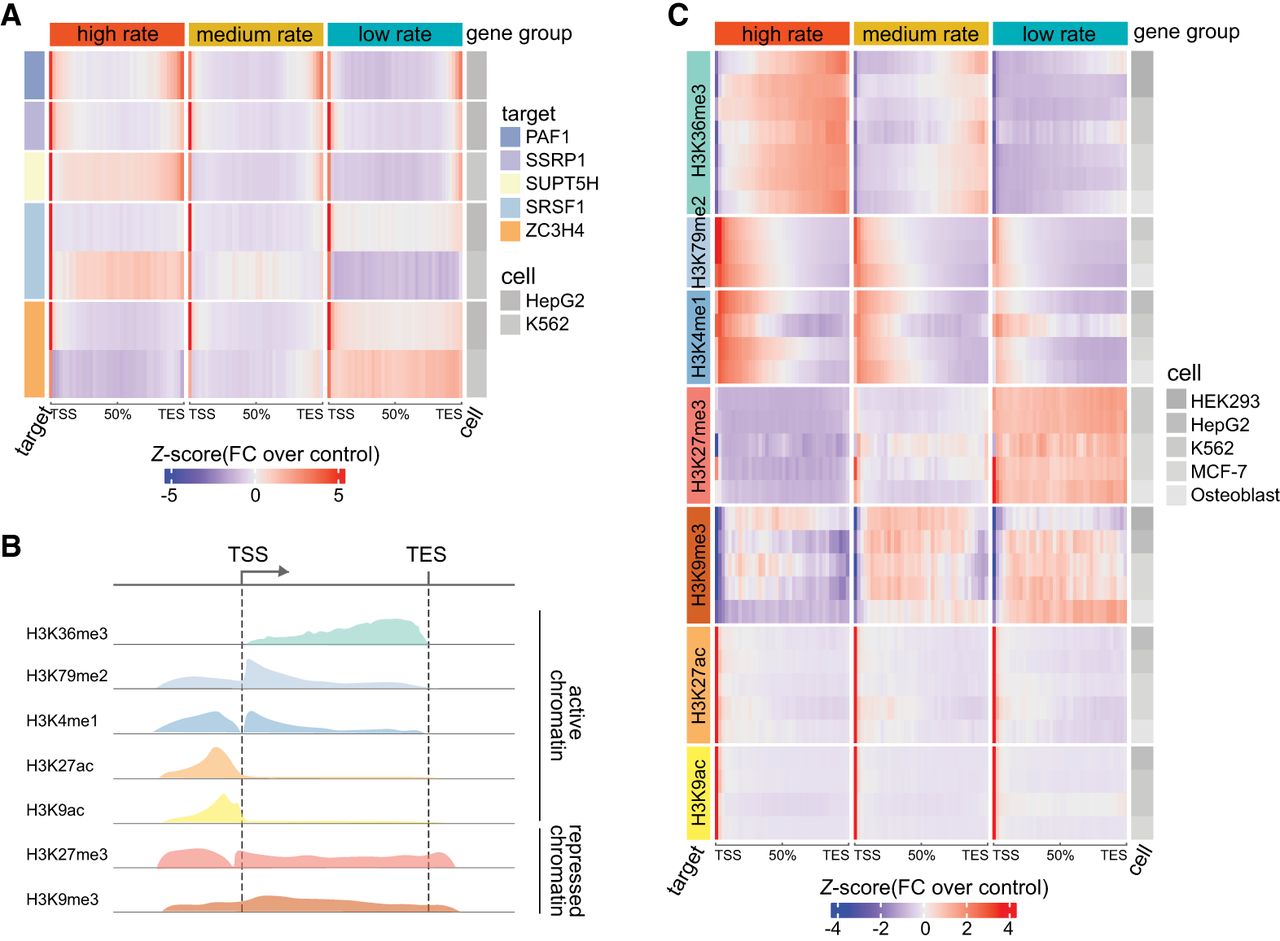
RNAPII transcription elongation rates are tightly associated with elongation factor binding and histone modifications. (A) Heat map displaying correlation between RNAPII elongation rates and RNAPII-associated elongation factor binding. Genes (n = 3009) with RNAPII elongation rate estimates were binned into three rate groups: high (4.28–7.02 kb/min); medium (3.93–4.28 kb/min); and low (0.14–3.93 kb/min). For each group, ENCODE ChIP-seq enrichment signals (see Methods) of elongation factor across gene bodies are displayed. The heat map colors represent Z-scores of fold change of ChIP-seq target signal relative to control. (B) Schematic illustration of the typical enrichment locations of various histone modifications based on ChIP-seq data relative to transcription start site (TSS) and transcription end site (TES). (C) Heat map displaying the correlation between RNAPII elongation rates and enrichment of histone modifications. The same 3009 genes were grouped equally by elongation rates as described in panel A. The histone modification enrichment of ENCODE ChIP-seq data sets across gene bodies is shown. Colors correspond to Z-scores of fold change of ChIP-seq target over control.


