
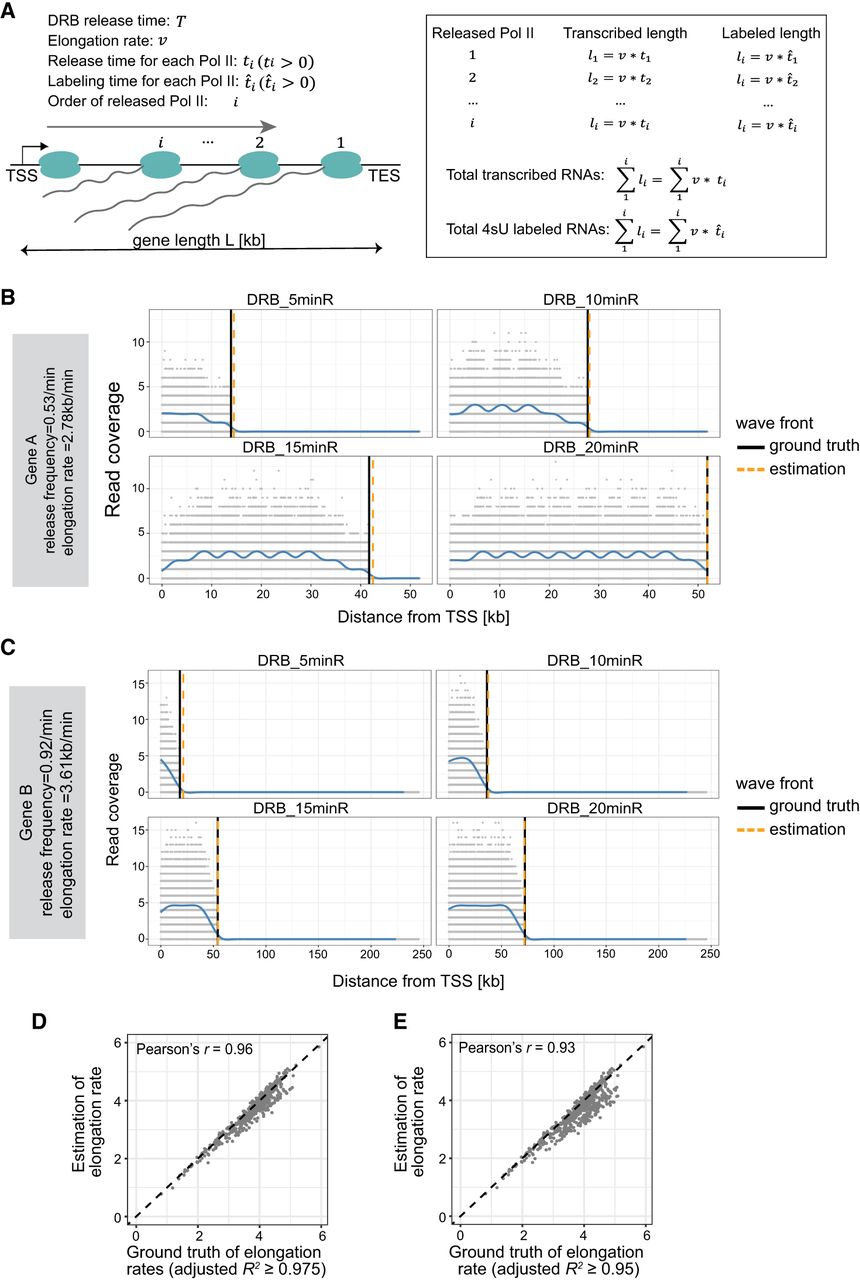
RNAPII elongation rates are estimated with high accuracy from simulated data. (A) Schematic illustration of the simulation model. (B) Example of a simulated gene with an RNAPII release frequency of 0.53/min and an elongation rate at 2.78 kb/min. Gray dots represent simulated read densities. Blue curves show the smoothed profiles. Vertical lines indicate the wave front positions from either the ground truth or computational estimation. (C) Example of another simulated gene with a different release frequency, elongation rate, and gene length. (D) Comparison of estimated RNAPII elongation rates with the ground truth values across 969 simulated genes. Genes were selected based on a linear regression adjusted R2 ≥0.975 (see Methods). (E) Same as shown in panel D but including 1061 genes selected using a slightly relaxed threshold (adjusted R2 ≥0.95) (see Methods).


