
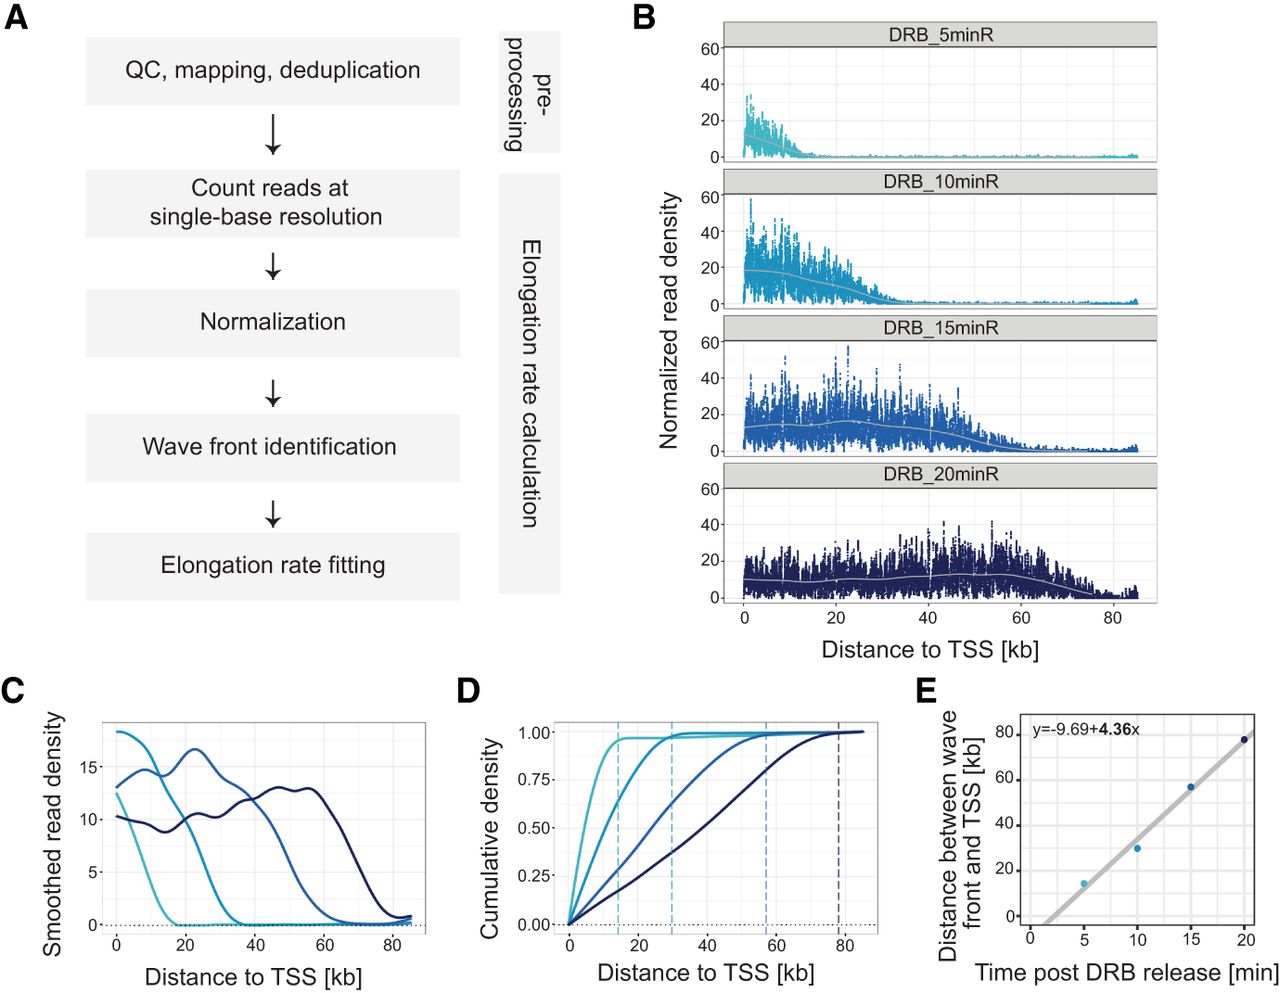
RNAPII elongation rates in DRB/TTchem-seq2 are calculated using transcription wave fronts. (A) Schematic illustration of the main data processing steps and RNAPII elongation rate estimation in DRB/TTchem-seq2. (B) Read coverage plots for an example gene CEMIP2 showing RNAPII elongation progression after DRB release. Read densities were calculated at single-base resolution from the annotated transcription start site (TSS) to transcription end site (TES), normalized to yeast spike-ins and the control sample (see Methods). (C) Smoothed splines of the read density profiles for gene CEMIP2 shown in panel B (see Methods). (D) Cumulative sums of the smoothed spline coverage from panel C for gene CEMIP2. Dashed lines mark the “elbow” point of the cumulative curves, indicating the transcription wave fronts (see Methods). (E) Linear regression of distance traveled by RNAPII versus DRB release time for gene CEMIP2 (see Methods). The slope corresponds to the RNAPII elongation rate.


