
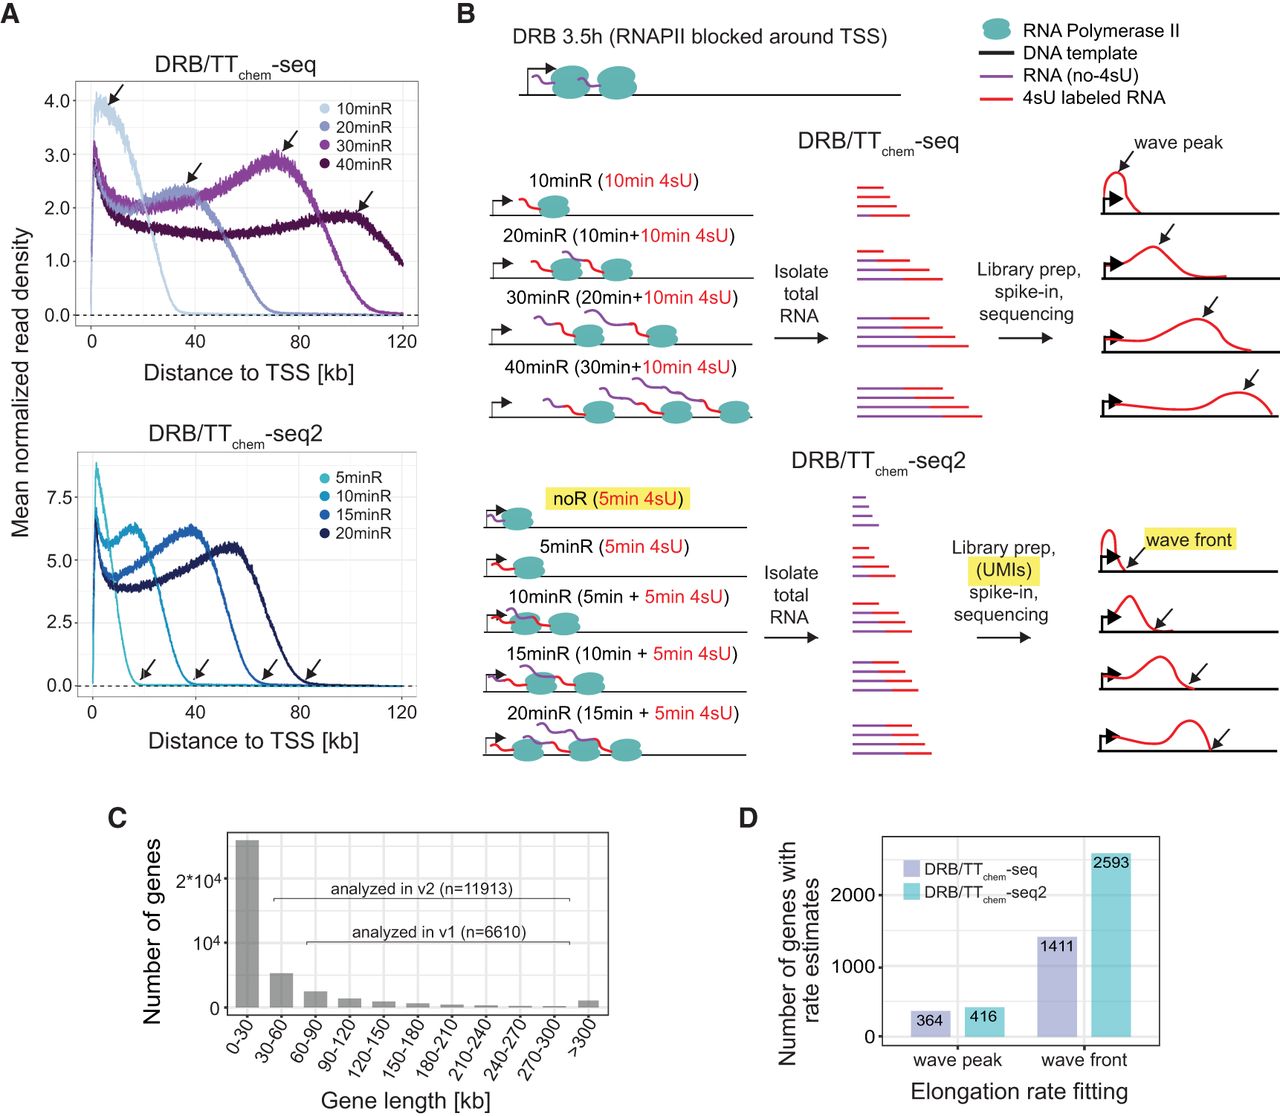
DRB/TTchem-seq2 enables estimation of RNAPII elongation rates for a larger number of individual genes. (A) Metagene plots showing the mean read density of nonoverlapping protein-coding and lncRNA genes from DRB/TTchem-seq and DRB/TTchem-seq2 data sets. Read depths were calculated from the transcription start site (TSS) to 120 kbdownstream. Black arrows indicate the positions of the wave peaks in DRB/TTchem-seq data and wave fronts in DRB/TTchem-seq2 data. (B) Overview of the DRB/TTchem-seq2 method with major modifications relative to DRB/TTchem-seq highlighted. A control sample without DRB release (noR) was included, where cells were treated with DRB for the same duration as other samples. The time durations post-DRB release were shortened to 0, 5, 10, 15, and 20 min. Correspondingly, 4sU incorporation times were reduced to 5 min, with 4sU added during the last 5 min of the experiments. Library preparation remains similar to DRB/TTchem-seq but incorporates Unique Molecular Identifier (UMI) as part of the sequencing adapter for PCR duplicates identification. Following sequencing, RNAPII elongation progression was identified by the transcription wave fronts instead of the wave peaks (see Methods). (C) Distribution of gene lengths for human protein-coding and lncRNA genes. The numbers of genes included in the RNAPII elongation rate analysis for both DRB/TTchem-seq and DRB/TTchem-seq2 are indicated. (D) Bar plots comparing the number of genes with RNAPII elongation rate estimates calculated from the same number of reads in DRB/TTchem-seq and DRB/TTchem-seq2.The DRB/TTchem-seq raw sequencing data were previously published (Pappas et al. 2023).


