
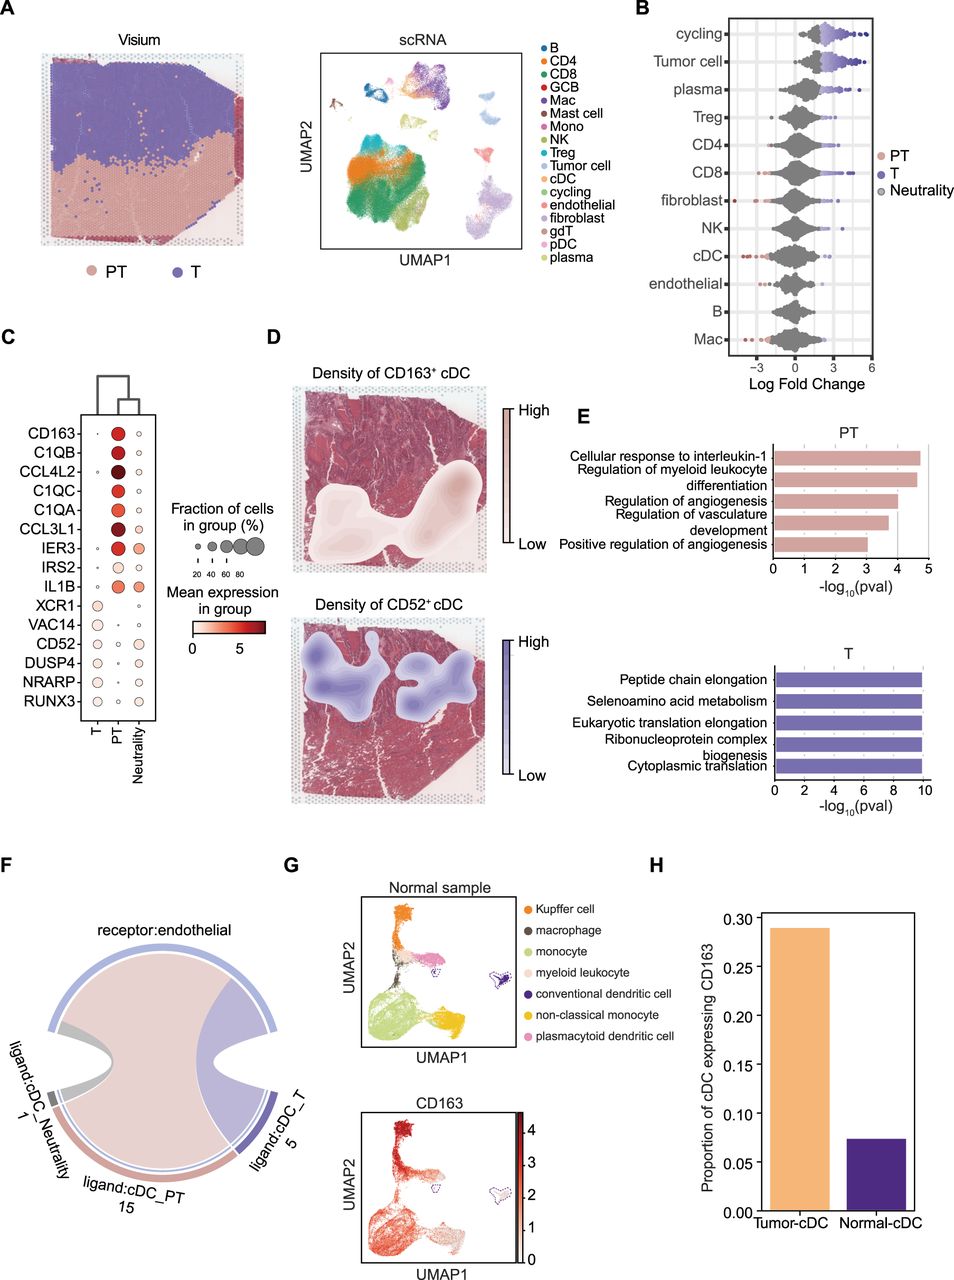
Analysis in colorectal cancer liver metastasis data. (A) Spatial transcriptomics sequencing data (Visium) of colorectal cancer liver metastasis (zones defined by pathology) and UMAP visualization of main cell types of scRNA data. (B) Spatial distribution preference of different cell types at paratumor (PT) and tumor (T) zones calculated using Milo. (C) Differential genes of conventional dendritic cell (cDC) subtypes distributed at different zones. (D) Spatial distribution density of different cDC subtypes at PT and T zones. (E) GO pathway enrichment of differential genes in different cDC subtypes, showing that pathways in CD163+ cDCs are potentially related to angiogenesis. (F) Number of ligand–receptor pairs between endothelial cells and different cDC subtypes. (G) UMAP representation of healthy liver tissue and the expression of CD163. (H) Proportion of CD163 gene expression in cDCs within liver cancer samples and healthy liver tissue.


