
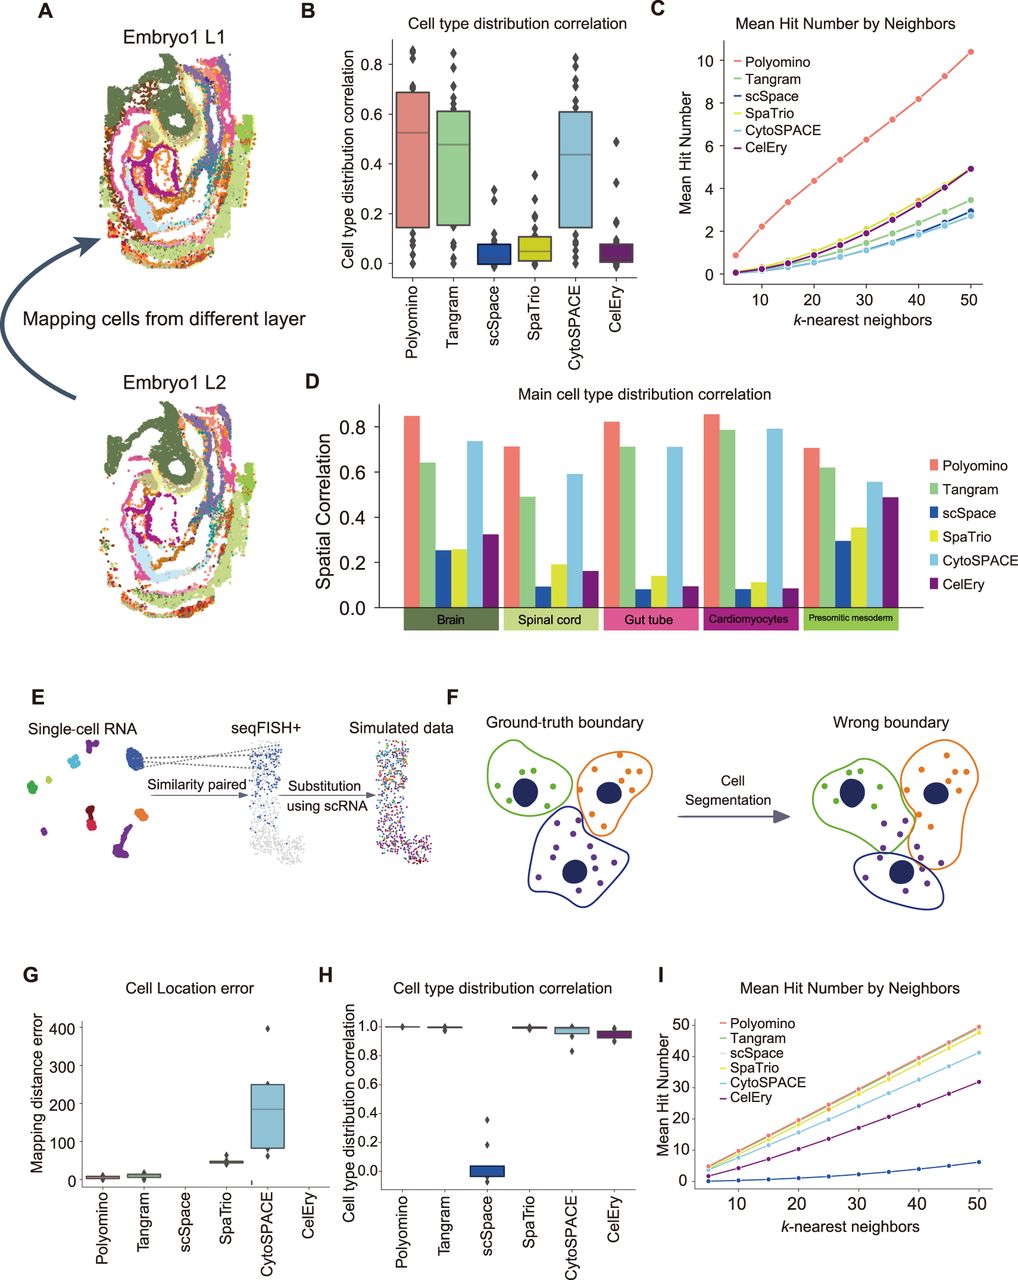
Benchmarking analysis of cell reconstruction and robustness to segmentation noise. (A) Schematic diagram of cell reconstruction using adjacent slices. Cells from two consecutive spatial layers (embryo1 L1 and L2) are shown, in which the goal is to reconstruct cell positions by mapping cells across layers. (B) Evaluation of spatial distribution similarity of cell types using different methods, measured by the correlation between predicted and actual cell-type proportions across spatial locations. Polyomino achieves the highest correlation. (C) Evaluation of spatial neighbor preservation. For each cell, the number of correctly identified neighbors (mean hit number) is calculated by comparing the top k-nearest neighbors in the reconstructed layer with ground truth. (D) Evaluation of spatial distribution similarity for five major cell types (brain, spinal cord, gut tube, cardiomyocytes, presomitic mesoderm). Polyomino consistently outperforms other methods in maintaining cell-type spatial correlation. (E) Schematic diagram for generating simulated single-cell spatial data. Using seqFISH+ and matched single-cell data, shared cell types are identified. For each spatial cell, the most similar single cell (based on Pearson's correlation of gene expression) is selected and used as a substitute to simulate realistic mapping conditions. (F) Illustration of segmentation error. The left panel shows ground-truth boundaries, and the right panel demonstrates how incorrect segmentation merges or splits cells improperly, affecting downstream mapping. (G) Mapping error under segmentation noise. Location error (measured as spatial distance between the predicted and true positions) is compared across methods. Polyomino and Tangram show the lowest error, whereas CelEry performs inconsistently. (H) Cell-type distribution correlation under segmentation errors. Polyomino and Tangram maintain high correlations, whereas scSpace shows a dramatic drop in performance. (I) Neighbor hit count under segmentation errors. Polyomino achieves the highest average number of correctly identified neighbors across different k-values, demonstrating strong robustness.


