
Abstract
In epigenetic analysis, the identification of differentially methylated regions (DMRs) typically involves the detection of consecutive CpGs groups that show significant changes in their average methylation levels. However, the methylation state of a genomic region can also be characterized by a mixture of patterns (epialleles) with variable frequencies, and the relative proportions of such patterns can provide insights into its mechanisms of formation. Traditional methods based on bisulfite conversion and high-throughput sequencing, such as Illumina, owing to the read size (150 bp) allow epiallele frequency analysis only in high CpG density regions, limiting differential methylation studies to just 50% of the human methylome. Nanopore sequencing, with its long reads, enables the analysis of epiallele frequency across both high and low CpG density regions. Here, we introduce a novel computational approach, PoreMeth2, an R library that integrates epiallelic diversity and methylation frequency changes from nanopore data to identify DMRs, providing insights into their possible mechanisms of formation, and annotate them to genic and regulatory elements. We apply PoreMeth2 to cancer and glial cell data sets, providing evidence of its advance over other state-of-the-art methods and demonstrating its ability to distinguish epigenomic alterations with a strong impact on gene expression from those with weaker effects on transcriptional activity.
In epigenetic analysis, a consolidated approach to detect methylation alterations between two samples consists in searching for groups of consecutive CpGs that concordantly show an increase (hypermethylation) or a decrease (hypomethylation) in their average methylation level (differentially methylated regions [DMRs]).
Current assays for determining CpG methylation involve bisulfite conversion of methylated cytosines to uracil, followed by sequencing methods such as reduced representation bisulfite sequencing (RRBS) and whole-genome bisulfite sequencing (WGBS). These techniques capture only a fraction of the genome, with RRBS covering 20%–25% and WGBS capturing 50%–70% of all CpGs at sufficiently high coverage, thus limiting analysis to regions with high CpG density (more than two to three CpG per 100 bp) (Sun et al. 2015).
However, the past decade has seen the emergence of long-read sequencing (LRS) technologies, based on nanopore sequencing (Clarke et al. 2009) and on single-molecule real-time (SMRT) sequencing (Rhoads and Au 2015), allow to produce sequences in the order of tens to hundreds of kilobases and to directly recognize base modifications, such as 5mC, thus allowing concomitant analyses of genomic and epigenomic changes (Magi et al. 2017, 2018, 2023a).
Using Oxford Nanopore Technologies (ONT) and a novel computational method, we recently reported that it is possible to infer the methylation state of 99% of all the CpG sites of the human reference genome (hg19, about 28.3 millions), with an average CpG density of one CpG per 100 bp, thus obtaining an unprecedented resolution for the identification of DMRs in low CpG density regions (Magi et al. 2023b). Most notably, application of this new technology to a chemoresistant acute myeloid leukemia (AML) data set allowed the identification of thousands of DMRs for each sample pair, with ∼50% of them falling within low CpG density regions (two or fewer CpG per 100 bp), which are not detected by classical bisulfite-based methods (Beck et al. 2022).
Results of our analyses were highly informative for the mechanisms of drug resistance in AMLs but also confirmed previous studies (Batra et al. 2021) showing that a significant proportion of differentially methylated genes (DMGs) were not differentially expressed. Such results suggest that a large fraction of the DMRs observed in our samples may be merely passenger events that accompany cancer evolution with weak or no effect on gene expression (Kalari and Pfeifer 2010).
The methylation state of a genomic region (a group of adjacent CpG sites) within a cell population is defined not just by its average methylation level but also by a mixture of patterns (epialleles) with variable frequencies. Changes in the relative frequency of these epialleles can provide insight into the origin of a DMR: An increase in the frequency of a specific epiallele may indicate a driver event, suggesting that this configuration was selectively favored owing to its potential functional relevance. In contrast, multiple stochastic changes in the frequencies of many epialleles are likely passenger events that accompany cellular evolution, reflecting random variation with limited biological impact.
To date, WGBS, RRBS, and methylation arrays have been used to study DMRs and epiallele composition. However, ∼42% of 3-CpGs (58% of 4- and 70% of 5-CpGs) epialleles are >150 bp, allowing the analysis of epiallele frequencies only in high-density CpG regions (CpG islands [CGIs]), strongly limiting their use in low-density CpG regions (fewer than three CpGs per 100 bp) in which short reads (150 bp) can overlap no more than two CpG sites. Long reads generated by nanopore sequencing, however, reach lengths in the order of tens of kilobases and are thus suitable to calculate epiallele frequency in both high- and low-density CpG regions, revolutionizing our capability to study methylome alterations.
In this work, we introduce a novel computational approach that, by combining epiallelic diversity changes with methylation frequency changes derived from long-read data, is capable of identifying DMRs and providing insights into their possible mechanisms of formation, distinguishing between selective expansions of specific epialleles (driver events) and stochastic epiallelic rearrangements (passenger events). The new approach was packaged in an R library, PoreMeth2, that also allows to automatically annotate DMRs with a new and efficient annotation scheme and generate useful graphical representations of the results.
We applied PoreMeth2 to a cancer data set and to a data set of human peripheral glial cells (HPGCs) treated with a G protein–coupled receptor agonist and observed that our approach may assist in distinguishing epigenomic alterations associated with the selection of epialleles that have a stronger effect on gene expression from those arising from random rearrangements of epialleles with weaker effects on transcriptional activity.
Results
DMRs detection
To estimate the impact of read length on the analysis of epiallele diversity, we simulated reads of various sizes (100 bp to 10 kb), and we evaluated their coverage across the human reference genome's CpG dinucleotide map (hg19; see Methods). As depicted in Supplemental Figure S1, reads >5 kb enabled epiallele diversity assessment in at least 99% of the epigenome.
At present, the methylation state of a CpG site is studied by using the methylation frequency β (calculated as the ratio between the total number of CpG sites predicted as methylated and the total number of reads aligned to that CpG) and differential methylation between test (T) and control (C) samples by using Δβ = βT − βC. Δβ takes values in the range [−1,1], where Δβ > 0 or <0 indicate, respectively, hyper- or hypomethylation of the test versus control samples.
Recently, we developed a novel tool (PoreMeth) based on a heterogeneous form of the shifting-level model (SLM) that is capable of identifying DMRs by segmenting methylation frequency differences (Δβ) inferred from ONT data (Magi et al. 2023b).
In this work, we expand the PoreMeth tool to include epiallelic diversity changes. The diversity of DNA methylation patterns in a cell population can be measured by using the Shannon entropy (Xie et al. 2011):
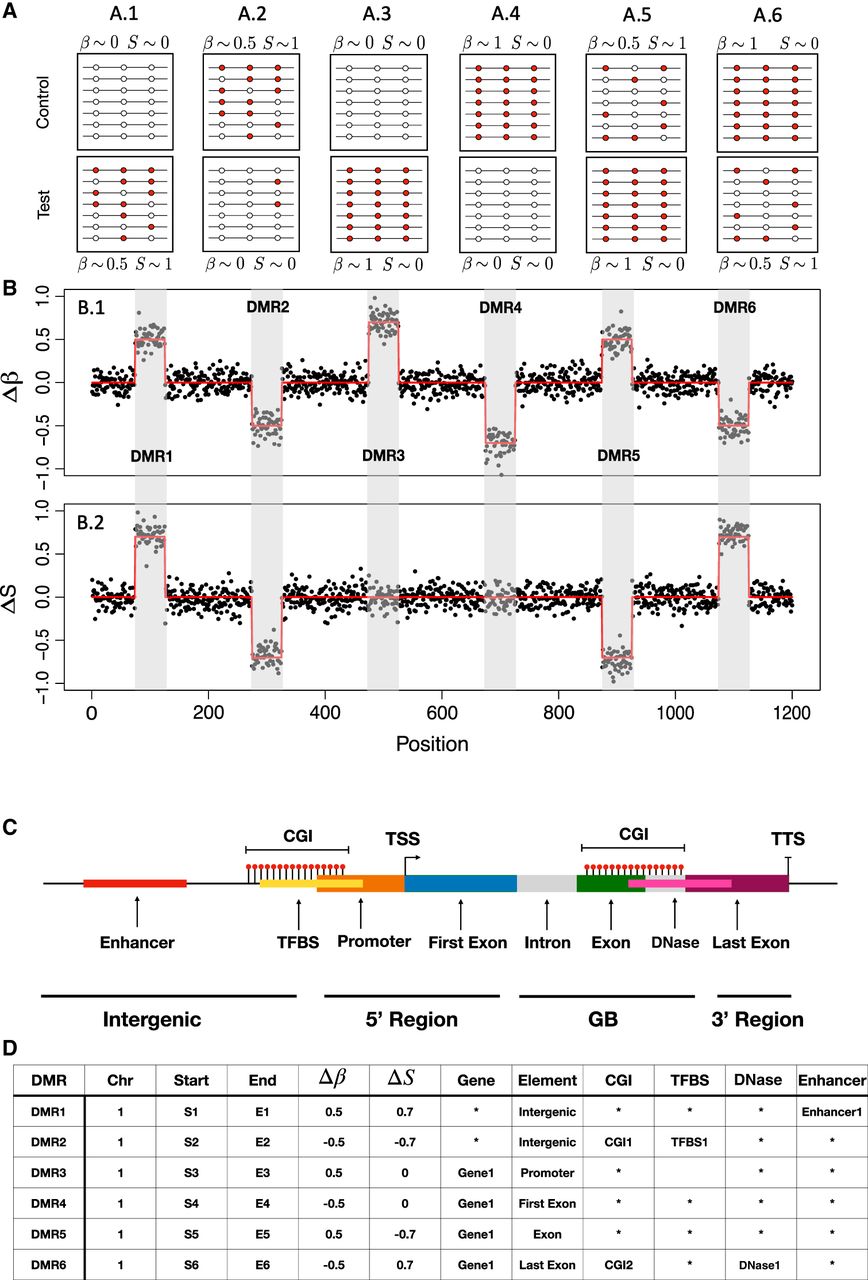
Computational workflow of PoreMeth2. (A) A schematic representation of the six possible epiallelic changes between test and control samples: hypermethylation with entropy increase (ΔS > 0.1 and Δβ > 0, A.1), hypomethylation with entropy decrease (ΔS < 0 and Δβ > 0, A.2), hyper- and hypomethylation with no entropy change ( and Δβ > 0, A.3, and Δβ < 0, A.4), hypermethylation with entropy decrease (ΔS < −0.1 and Δβ > 0, A.5), and hypomethylation with entropy increase (ΔS > 0 and Δβ < 0, A.6). PoreMeth2 takes as input the methylation calls from Nanopolish, Guppy, or Dorado and calculates methylation frequency and entropy. (B) Δβ (B.1) and ΔS (B.2) signals calculated for each CpG dinucleotide and ordered for genomic position. The two signals show six DMRs that reflect the epiallelic diversity changes reported in A. To identify epiallelic composition changes the two signals xi are modeled with SLM as the sum of two independent stochastic processes (xi = mi + εi), where mi = (mi1, mi2) is the vector of the unobserved mean level, and εi is the vector of white noises. The white noise vector εi follows a bivariate normal distribution with mean με = [0] and covariance matrix Σε; zi are random variables taking the values in [0,1] with probabilities η = Pr(zi = 1) (1 − η = Pr(zi = 0)); δi are random vectors that follow a bivariate normal distribution, and μi is the vector of the means (see Methods). DMRs identified with the bivariate version of the SLM algorithm can then be annotated with a scheme that reports all the genic elements overlapping a DMR, and for each of these elements, it calculates the overlap with regulatory feature (CGI, enhancers, TFBS, and DHS). (C) The gene model used for PoreMeth2 annotation and (D) the annotation results of the six DMRs.
When analyzing methylation differences between samples undergoing evolutionary processes, such as healthy cells and tumor cells derived from the same tissue, tumors at diagnosis versus relapse, or cells before and after pharmacological treatment, studying the differential entropy of a DMR (ΔS) may help to distinguish between the selection of a specific epiallele (ΔS < 0) from the stochastic changes of multiple epialleles (ΔS > 0). In this context, ΔS < 0 is associated with a homogenization of the epiallelic composition, suggesting the dominance of a specific epiallele, whereas ΔS > 0 corresponds to an increase in epiallelic heterogeneity, indicative of random diversification among epialleles.
In particular, by combining ΔS and Δβ, we can observe six different possible epiallelic diversity changes between test and control samples (Fig. 1B): stochastic change with hypermethylation (ΔS > 0 and Δβ > 0) (Fig. 1A.1) and hypomethylation (ΔS > 0 and Δβ < 0) (Fig. 1A.6), selective change with hypermethylation (ΔS < 0 or and Δβ > 0) (Fig. 1A.3,A.5), and selective change with hypomethylation (ΔS < 0 or and Δβ < 0) (Fig. 1A.2,A.4). We have included both hypermethylation and hypomethylation with in the selective change category (Fig. 1A.3,A.4) as these reflect epigenomic alterations that may arise from selection, despite the fact that the level of homogenization in the epiallelic composition remains unchanged. Indeed, when the increase or decrease in methylation level results from a selective process, in which a specific epiallele (originating from a single cell) expands, epiallelic entropy does not increase (if all cells share that pattern) or increases only minimally (if those cells represent a subpopulation). In this scenario, we consider isoentropic DMRs, defined as those with an absolute value of ΔS below a given threshold. This approach allows us to prioritize DMRs with low entropic variation that may have arisen through selective mechanisms.
To identify all the possible epiallelic diversity changes between the test and control samples, we developed a bivariate version of the SLM algorithm (BiSLM) that is capable of simultaneously analyzing and segmenting ΔS and Δβ values (see Methods). In summary, our method processes the ΔS and Δβ values of consecutive CpG dinucleotides to identify genomic regions exhibiting increased or decreased methylation and entropy levels between two samples (Fig. 1B).
The calculation of methylation entropy is performed using a sliding window that includes b consecutive CpGs. Starting from the first b CpGs, entropy is computed, and at each step, the window is shifted by one CpG to calculate the entropy for the next window. For each CpG j, the entropy is calculated for the epiallele spanning from the jth to the (j + b − 1) − th CpG. If a read contains an uncalled methylation site within a given window of b CpGs, that read is excluded from the entropy calculation for that specific window.
To evaluate the performance of our algorithm in detecting DMRs across different sizes and epiallelic changes, we applied BiSLM to simulated methylation profiles (see Supplemental Figs. S2–S7). Our results demonstrate that BiSLM accurately identifies DMRs as small as five consecutive CpGs with a sequencing coverage of at least 20× (see Supplemental Fig. S8). Furthermore, by benchmarking BiSLM against two different computational methods for DMR identification (Modkit and BSmooth), we established its superior performance in detecting DMRs across the entire tested range of CpG numbers (from five to 50) and in precisely defining their boundaries (see Supplemental Material and Supplemental Fig. S8).
DMR annotation
Several studies have shown that promoter methylation in CGIs leads to downregulation of tumor-suppressor gene expression, thus representing a critical mechanism in cancer development (Jones and Baylin 2002). Recently, we demonstrated that hypermethylated genes at sparse CpGs in the gene body are significantly enriched in transcription factors (TFs) that deregulate large gene regulatory networks inducing drug resistance in AML patients (Magi et al. 2023b). Furthermore, other studies demonstrated that DNA methylation at transcription factor binding sites (TFBSs) can influence gene expression by regulating the ability of TFs to bind to their target DNA sequences (Kaluscha et al. 2022). These findings demonstrate the fundamental importance of studying the colocalization between genic elements (promoters, introns, exons) and regulatory features (CGIs, TFBS, enhancers) within the same DMR in order to elucidate their impact on gene expression and phenotypes.
At present, few tools have been developed for annotating genomic intervals to genic and regulatory elements, including GoldMine (Bhasin and Ting 2016), annotatePeaks.pl from HOMER tool (Heinz et al. 2010), GenomicDistributions (Kupkova et al. 2022), and the R package annotatr (Cavalcante and Sartor 2017). These tools can annotate genomic intervals by following one of two different strategies: (1) reporting a single genic feature by using feature priority (using gene models with the priority order promoter > 3' end > exon > intron > intergenic) or (2) reporting each genic and regulatory feature overlapping the interval as a row (long format).
The feature-priority annotation scheme allows one to obtain only partial information on the functional impact that a DMR may generate, especially when the epigenomic alterations are large and affect multiple genes and multiple regulatory features, whereas the “all-feature” scheme is very complex to summarize. Moreover, none of these methods allow the study of the reciprocal overlap between gene model elements and regulatory features, thus limiting the interpretation of functional effect of a DMR.
For these reasons, we implemented a novel annotation scheme that reports all the genic elements (promoter, first exon, internal introns and exons, and 3′ untranslated region [UTR]) overlapping a DMR, and for each of these elements, it calculates, when present, the overlap with regulatory features such as CGIs, enhancers, TFBSs, and DNase I hypersensitive sites (DHSs) (see Fig. 1C,D).
This annotation scheme not only identifies each genic element affected by a DMRs but also evaluates its functional interaction with regulatory features. Moreover, each overlap is quantified in terms of percentage, allowing one to discriminate genomic elements when few bases are affected by a DMR from those when the DMRs have a greater overlap, permitting a more precise interpretation of its functional impact.
The BiSLM algorithm and the novel annotation scheme were integrated in an R package named PoreMeth2 that automatically identifies and annotates DMRs by comparing LRS methylation data of a pair of test and matched normal samples (see Methods). PoreMeth2 also allows a gene-based annotation using a feature-priority scheme in which each gene affected by a DMR is classified as either 5′-regulatory regions (5′Reg; if the DMR overlaps with the promoter, 5′ UTR, or the first exon), 3′ UTRs (if the DMR overlaps with the last exon but not with 5′Reg elements), or gene bodies (GBs; if the DMR overlaps with internal introns or exons but not with 5′Reg or 3′-UTR elements). 5′Reg dominance in our feature-priority scheme underscores the pivotal role of promoter methylation in regulating gene expression. According to the classical epigenetic paradigm, methylation of 5mC within gene promoters sterically hinders TF binding, thereby repressing transcription, whereas unmethylated promoters permit access by TFs and RNA polymerase II, enabling transcription initiation. Because this on/off switch at promoters has a far more immediate and decisive impact on gene regulation than methylation in other contexts (e.g., gene bodies or intergenic regions), assigning DMRs that overlap multiple features to 5′Reg first ensures that the most functionally relevant regulatory element is captured.
The feature-priority scheme maintains the regulatory elements overlap and can be very useful to study the correlation of DMRs with other omic layers such as gene expression. The annotation functions of PoreMeth2 are powered by Fortran libraries that can annotate tens of thousands of DMRs in parallel in minutes (Methods) (Fig. 1C).
AML data analyses
To test the power of PoreMeth2, we analyzed methylation data from AML sample pairs that our previously work Magi et al. (2023b), in which we demonstrated that in relapsed AML hypermethylated genes at sparse CpGs in the gene body were significantly enriched in cancer genes (oncogenes and tumor suppressor) and cancer-related pathways. The data set consists of sample pairs at diagnosis (T) and relapse (R) from three AML patients (UD5, UD10, and AML2) who received standard chemotherapy and relapsed with chemoresistant disease (see Methods). The six samples were sequenced with ONT sequencer obtaining, for each sample, a sequencing coverage of 20×–30× (see Methods) (Supplemental Material) with no significant differences between all genomic regions and repeated regions (see Supplemental Materials; Supplemental Fig. S9).
As a first step, we calculated methylation frequency (β) and entropy (S; by using b = 3) (see Supplemental Material; Supplemental Fig. S10) for each sample; we applied BiSLM to each pair of AML samples (see Methods); and we classified DMRs in six different categories reflecting Δβ (hypermethylation, Δβ > 0.2; hypomethylation, Δβ < −0.2) and ΔS (hyperentropic, ΔS > 0.1; isoentropic, −0.1 < ΔS < 0.1; hypoentropic, ΔS < −0.1) variations. Because of the read size obtained by our ONT runs, we were able to calculate epiallelic diversity measures (S) for 80%–90% of epialleles with at least five reads (Supplemental Fig. S11).
Our algorithm identified 3102 DMRs for UD5 (3.18 Mb of genomic regions) (Supplemental Table 1), 2825 for UD10 (3.07 Mb) (Supplemental Table 2), and 2874 for AML2 (3.18 Mb) (Supplemental Table 3), with a significantly larger fraction of hypermethylated versus hypomethylated DMRs, in terms of both numbers (1999 vs. 1103 for UD5, 2292 vs. 533 for UD10, and 2575 vs. 299 for AML2) (Fig. 2A) and total size (1930 kb vs. 1250 kb for UD5, 2570 kb vs. 500 kb for UD10, and 2860 kb vs. 320 kb for AML2) (Supplemental Fig. S12; Supplemental Material). Moreover, both hyper- and hypomethylated DMRs were equally distributed among the three epiallelic change categories in terms of number (Fig. 2A) and size (Supplemental Fig. S12).
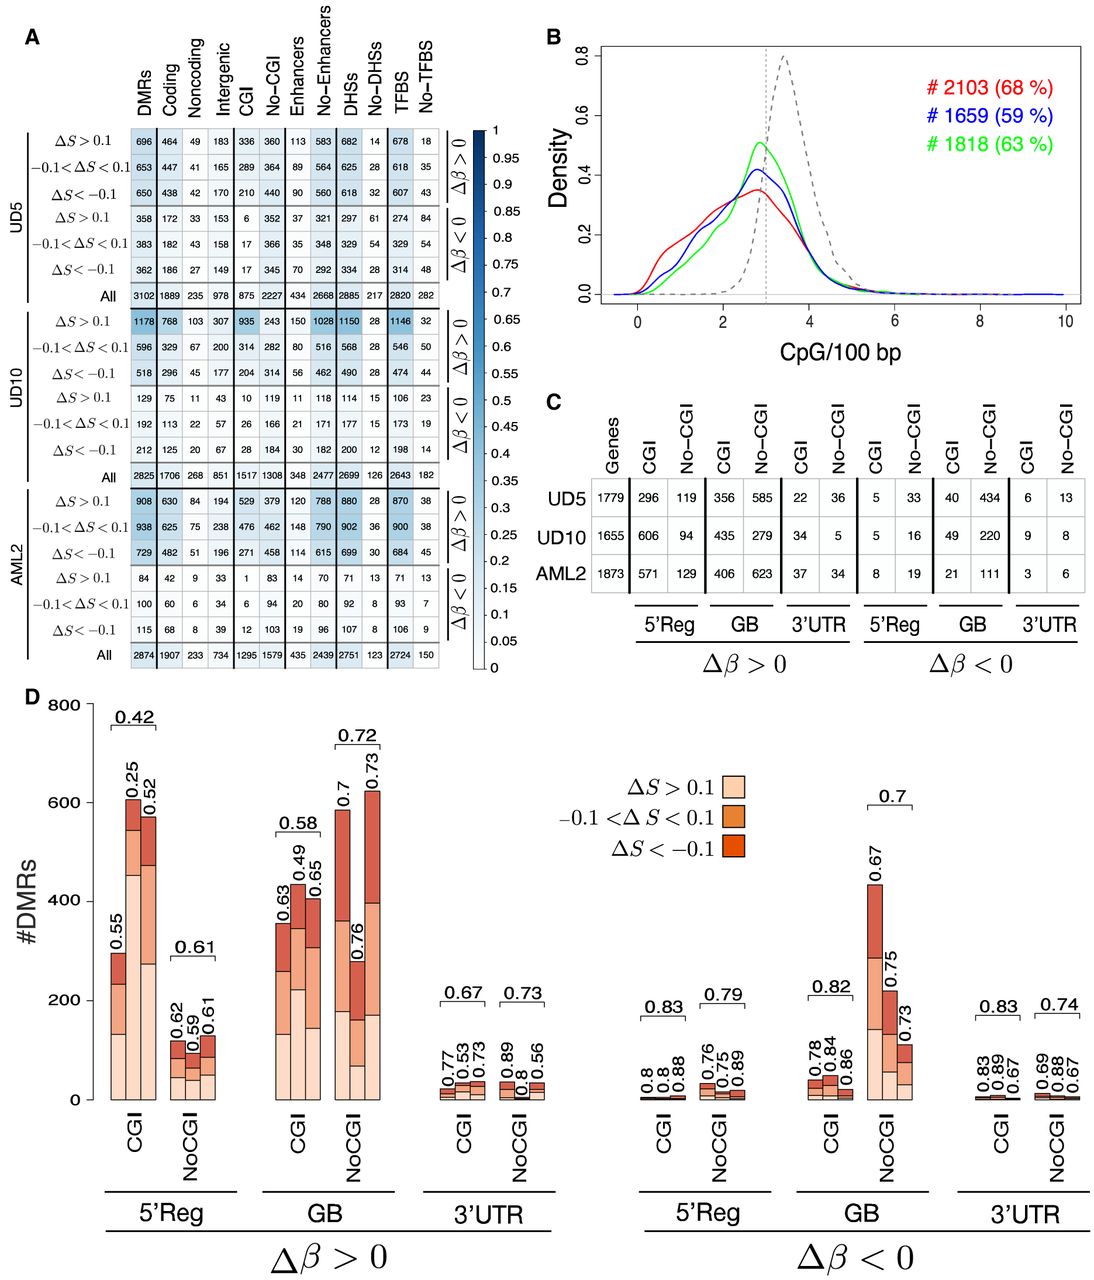
DMRs of the three pairs of AML samples. (A) The number of DMRs detected by BiSLM in the three AML pairs for all the six categories reflecting Δβ (hypermethylation, Δβ > 0.2; hypomethylation, Δβ < −0.2) and ΔS (hyperentropic, ΔS > 0.1; isoentropic, −0.1 < ΔS!0.1; hypoentropic, ΔS < −0.1) variations. Numbers are reported for DMRs overlapping protein-coding genes (coding), noncoding genes (noncoding), intergenic regions (intergenic), CpG islands (CGIs), enhancers, DNase I hypersensitive sites (DHSs), and transcription factor binding sites (TFBSs). (No-CGI, no-enhancers, no-DHSs, and no-TFBS) The number of DMRs that do not overlap with CGI, enhancers, DHSs, and TFBS, respectively. The color intensity in each cell reflects the proportion of DMRs of a category with respect to all DMRs for each sample according to the colorbar. (B) CpG density distribution of the DMRs detected by BiSLM on the three pairs of AML samples. The vertical dotted line indicates ERRBS resolution limit (three or fewer CpGs per 100 bp). Text on left side of the plot reports the total number (#) and on the right side the percentage (%) of DMRs detected by PoreMeth with CpG density of two or fewer CpGs per 100 bp (left) or three or fewer CpGs per 100 bp (right). The table of C reports the total number of DM genes with DMRs at different genomic elements (5′ regulatory region [Reg], internal introns and exons [GB], 3′ UTR) inside CGIs and outside CpG islands (NoCGIs). The bar plot of panel D reports the number of hyperentropic (ΔS > 0.1), hypoentropic (ΔS < −0.1), and isoentropic (−0.1 < ΔS < 0.1) epiallelic changes for hyper- and hypomethylated genes with DMRs overlapping different genic elements at CGI and sparse CpGs (NoCGIs). Numbers above bars show the percentage of hypoentropic (ΔS < −0.1) or isoentropic (−0.1 < ΔS < 0.1) DMGs. Horizontal brackets above each group of three bars summarize average percentages of the three samples.
To validate the performance of PoreMeth2, we compared the DMRs identified by our method with those detected by Modkit and BSmooth on the same sample pairs (see Supplemental Material; Supplemental Figs. S13–S15). PoreMeth2 identified a substantially larger number of DMRs across a much broader size spectrum and a wide range of Δβ values. BSmooth detected just more than 100 DMRs per pair (116 for UD5, 166 for UD10, and 137 for AML2), whereas Modkit identified a large number of DMRs (4114 for UD5, 801 for UD10, and 1279 for AML2), most of which contained only a few CpGs. The average size of DMRs detected by our tool ranged from 700 to 800 bp across all three AML pairs, with a distribution spanning from a few hundred base pairs to tens of kilobases and with no significant differences between the six DMR categories (Supplemental Fig. S16). BSmooth identified DMRs with an average size of 300–500 bp, whereas Modkit exhibited a bimodal size distribution, with the first peak at just a few bases (driven by the high number of DMRs containing only a few CpGs) and the second peak at 100 to 200 bp. Moreover, although our approach identified DMRs across a wide range of Δβ values, the other two methods tended to call DMRs with much more pronounced methylation frequency changes (panels D of Supplemental Figs. S13–S15). Approximately 60% to 70% of the DMRs identified by our method and BSmooth exhibited a CpG density of three or fewer CpG per 100 bp, which corresponds to the resolution limit of standard Illumina reads, whereas only of the DMRs detected by Modkit fell within this range (panels C of Supplemental Figs. S13–S15).
The reciprocal overlap between the DMRs identified by our approach and BSmooth is nearly complete, whereas the overlap with Modkit is considerably lower (Supplemental Fig. S17A–C). Most DMRs detected exclusively by Modkit contain fewer than four CpGs, and those with more than five CpGs display Δβ values close to zero, suggesting the absence of true differential methylation (Supplemental Fig. S17D–F). In contrast, the DMRs identified exclusively by PoreMeth2, comprising ∼80%–90% of the total, are highly reliable, as indicated by their very high statistical significance scores as calculated using Modkit (see Supplemental Material; Supplemental Fig. S18). These findings highlight the superior capability of our method in accurately detecting DMRs across a broad spectrum of CpG densities and Δβ values. Moreover, they demonstrate that LRS, combined with our novel computational approach, enables the identification of epiallelic changes between test and control samples at an unprecedented resolution. To further demonstrate the superior performance of PoreMeth2 in detecting precise DMR boundaries, we visualized selected examples using the Integrative Genomics Viewer (IGV) (Supplemental Figs. S19–S24; Robinson et al. 2011). This advancement extends differential methylation analysis of high-density CpG regions (CGIs), as achieved until now, to sparse CpGs (Fig. 2B).
To evaluate the functional impact of the epiallelic changes identified by our segmentation strategy, we used the annotation module of PoreMeth2, and we studied the distribution of DMRs across genic and regulatory elements. Most DMRs mapped within annotated protein-coding genes (62%, 67%, and 66% for UD5, UD10, and AML2, respectively), ∼10% in noncoding genes (noncoding RNAs, pseudogenes, and processed transcripts), and 30% in intergenic regions (nonoverlapping GENCODE elements). Moreover, the great majority of DMRs overlapped DHSs (90%, 92%, and 93%) and TFBSs (90%, 92%, and 93%), with a small fraction also overlapping enhancers (13%, 12%, and 13%) (Fig. 2A). As expected from CpG density distribution, 18%, 44%, and 29% DMRs (for UD5, UD10, and AML2, respectively) overlapped CGIs, whereas the remaining were located in low-density CpG regions (Fig. 2A).
As a further step, we used the annotation module of PoreMeth2 to classify protein-coding genes in three main functional categories: 5′ regulatory regions (5′Regs; if the DMR overlaps with promoter, 5′ UTR, or first exon), 3′ UTRs (if the DMR overlaps with the last exon but not with 5′Reg elements), and gene bodies (GBs; if the DMR overlaps with internal introns or exons but not with 5′Reg or 3′-UTR elements). The number of protein-coding genes affected by DMRs (DMGs) were about 1700 per patient (1779, 1655, and 1873 for UD5, UD10, and AML2, respectively) (Fig. 2C), most of which hypermethylated (∼70%, ∼95%, and ∼93% in UD5, UD10, and AML2, respectively) (Fig. 2C). Twenty-five percent to 40% showed DMRs at 5′Reg, 60%–80% at GBs, and at 3′ UTRs (Fig. 2C).
DMGs with hypermethylated DMRs in 5′Reg mainly involved CGIs ( across the three samples: 71%, 86%, and 81% for UD5, UD10, and AML2), whereas DMG with hypermethylated DMRs at gene bodies mostly overlapped sparse CpGs ( across the three samples). Hypomethylated genes were almost entirely associated with DMRs overlapping sparse CpGs (), regardless of their position within genes (Fig. 2D). Moreover, the great majority of DMGs showed hypoentropic (ΔS < −0.1) or isoentropic (−0.1 < ΔS < 0.1) epiallelic changes (between 60% and 80% for both hyper- and hypomethylation), with the exception of DMGs with hypermethylated DMRs in 5′Regs at CGIs (for which hyperentropic changes represent 60%) (Fig. 2D).
To investigate the impact of DMRs on gene expression, we analyzed the six AML samples with triplicate RNA sequencing experiments (RNA-seq) and studied differential gene expression between the relapse and diagnosis samples using DESeq2 (see Methods) (Love et al. 2014). We identified 3997, 4677, and 1759 differentially expressed genes (DEGs) (Supplemental Table 4) in UD10, UD5, and AML2, respectively, with different ratios of over- and underexpressed genes (2044 and 1953 in UD5, 2890 and 1787 in UD10, and 495 and 1264 in AML2) (Supplemental Table 4).
As a first step, we leveraged RNA-seq data to investigate whether methylation alterations were present in the promoter regions of DEGs that were not identified by PoreMeth2. To this end, we recalculated the average Δβ across the entire promoter region of all DEGs and compared these values with the results obtained using our method (see Methods). Overall, only 37 out of 10,433 DEGs (3997, 4677, and 1759 across the three sample pairs) exhibited a promoter Δβ greater than 0.2 or smaller than −0.2, and 29 of these had a DMR identified by PoreMeth2 within the promoter region (see Supplemental Figs. S25–S27). Moreover, among the nine DEGs not detected by PoreMeth2, the recalculated Δβ was very close to −0.2 or 0.2, suggesting that these methylation changes are subtle and thus more challenging to detect. Overall, this additional analysis highlights the high accuracy of our segmentation approach in identifying DMRs. Next, we studied the differential expression of DMGs for different ΔS and Δβ categories. As shown in Supplemental Figure S28, the proportion of DEGs among all the DMGs is comparable between those associated with hyperentropic (ΔS > 0.1) and hypo/isoentropic (ΔS < 0.1) DMRs (10% for hypermethylated genes on CGIs and 30% for other categories).
Considering only DM-DEGs, we found that the great majority are affected by hypo/isoentropic (ΔS < 0.1) epiallelic changes, suggesting that epiallelic selection have stronger effect on gene transcription (Fig. 3A). We then analyzed the proportion of DMGs that were also DEGs (DM-DEGs) with respect to all DEGs considering separately genes affected by DMRs at different genic elements in CGIs or sparse CpGs, and we found that mainly DMGs with DMRs at sparse CpGs in gene body with ΔS < 0.1 (hypo- and isoentropic) are significantly enriched of DEGs across the three samples (Fig. 3B). This can be explained by the fact that most hypermethylated genes with hypo/isoentropic (S < 0.1) changes show tumor β values (β Tum) above 0.2 and tend toward full methylation (β Rel between 0.7 and 1). In contrast, hyperentropic genes typically start from very low tumor β values (0–0.2) and become partially methylated (β Rel 0.2–0.5) (see Supplemental Fig. S29).
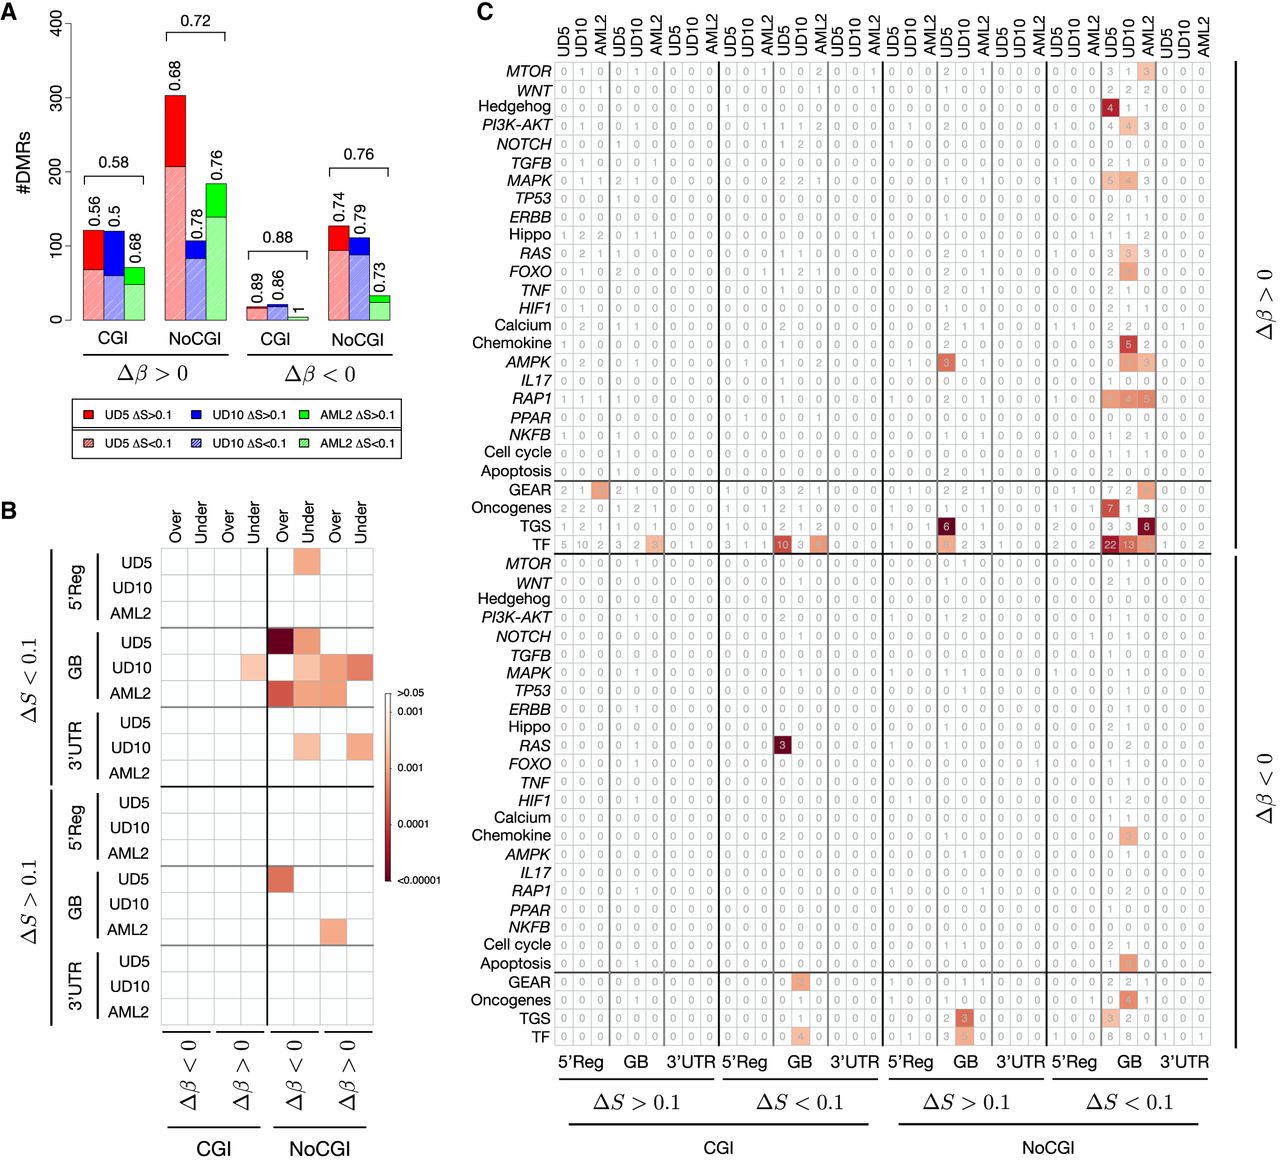
DMRs and differential expression. (A) The proportion of DM-DEGs with hyperentropic (ΔS > 0.1) and iso- or hypoentropic (ΔS < 0.1) DMRs. Results are reported for hyper- (Δβ > 0.2) and hypomethylated (Δβ < −0.2) DMRs overlapping CGIs and outside CpG islands (NoCGIs). Textured bars show the number of DM-DEGs with iso- or hypoentropic (ΔS < 0.1) DMRs. (B) The results of ORA for DM-DEGs. The analysis was performed separately for genes affected by DMRs at the 5′ regulatory region (5′Reg), the gene body (GB), and the 3′ UTR and for DMRs overlapping CGIs and NoCGIs. The blocks of the corrplot report the results of ORA for different classes of DMRs formation: Δβ > 0.2 and ΔS < 0.1 (hypermethylated and hypo- and isoentropic), Δβ > 0.2 and ΔS > 0.1 (hypermethylated and hypo- and isoentropic), Δβ < −0.2 and ΔS < 0.1 (hypomethylated and hypo- and isoentropic), and Δβ < −0.2 and ΔS > 0.1 (hypomethylated and hypo- and isoentropic). The color intensity in each cell reflects the statistical significance according to the colorbar. For each category, Fisher's exact tests were calculated comparing the number of DM-DEGs, DMGs, DEGs, and all genes tested in RNA-seq experiments. (C) The results of ORA for underexpressed DM-DEGs. The analysis was performed separately for genes affected by DMRs at the 5′ regulatory region (5′Reg), the gene body (GB), and the 3′ UTR and for DMRs overlapping CGIs and NoCGIs. The blocks of the corrplot report the results of ORA for different classes of DMRs formation: Δβ > 0.2 and ΔS < 0.1 (hypermethylated and hypo- and isoentropic), Δβ > 0.2 and ΔS > 0.1 (hypermethylated and hypo- and isoentropic), Δβ < −0.2 and ΔS < 0.1 (hypomethylated and hypo- and isoentropic), and Δβ < −0.2 and ΔS > 0.1 (hypomethylated and hypo- and isoentropic). The numbers in each cell represent the total number of DM-DEGs for each category, and the color intensity reflects the statistical significance according to the colorbar. Fisher's exact test and number of genes were calculated for cancer-related pathways selected from KEGG database, TFs, TSGs, and oncogenes selected by COSMIC and GEAR genes.
As a final step, to evaluate DMRs’ effect in terms of expression at each genomic feature, we performed overrepresentation analyses (ORAs) of DMGs pertaining to each subclass of DMRs, that were also DE. ORA was performed on DM-DE genes against a collection of cancer-related pathways (KEGG) (Kanehisa and Goto 2000), tumor suppressor genes (TSGs) and oncogenes (from the COSMIC database) (Tate et al. 2019), TFs (Lambert et al. 2018), and drug-resistance-associated genes (GEAR) (Wang et al. 2017). DM-DE genes with DMRs overlapping CGIs showed few significant overrepresentations of the tested data sets, regardless of methylation status or expression (Fig. 3C). The same was observed for the DM-DEGs at sparse CpGs with hyperentropic epiallelic changes (ΔS > 0.1). Hypermethylated DMGs with ΔS < 0.1 (hypo- or isoentropic) at sparse CpGs in gene bodies instead were enriched in TFs and cancer pathways in all three patients (Fig. 3C).
These results are consistent with our previous findings in which we showed that hypermethylated genes with DMRs in sparse CpGs at the gene body display a higher fraction of DEGs compared with those with DMRs in CGIs and that these DMRs affect patient-specific master TFs, the primary drivers of gene deregulation associated with the chemoresistant phenotype (Magi et al. 2023b).
Taken as a whole, these results demonstrate that hypo- or isoentropic epiallelic changes (ΔS < 0.1) have a stronger impact on gene expression compared with changes generated randomly and that these genes are enriched in cancer pathways. No significant overlap between DMGs was found among the three samples (see Supplemental Material; Supplemental Figs. S30–S32), confirming our previous results in which we demonstrated that patient-specific master TFs are the main drivers of gene deregulation associated with chemotherapy resistance (Magi et al. 2023b).
Human peripheral glial cells
To test our method on a different experimental setup, suited to the evaluation of methylation state evolution, we applied the analysis to sequencing data obtained from HPGC cultures before (T0) and after 48 h (T48) treatment with a G protein–coupled receptor agonist (see Methods) (Supplemental Material).
Methylation frequency (β) and entropy (S) were calculated for the T0 and T48 samples, and we then applied BiSLM to classify DMRs in six different categories reflecting Δβ and ΔS variations (as in the previous section). Given the high coverage and read size, we were able to calculate ΔS values for >99% of epialleles with at least five reads (Supplemental Fig. S33). Moreover, we did not observe significant differences between all genomic regions and repeated regions (see Supplemental Materials; Supplemental Fig. S34).
BiSLM identified 636 DMRs (Supplemental Table 5), most of which are hypermethylated in terms of both number and length (616 hypermethylated vs. 20 hypomethylated) (Fig. 4A). Additionally, 80%–95% of the DMRs (80% for the hypermethylated and 95% for the hypomethylated) are iso- or hypoentropic (Fig. 4A). Cumulative size and size distribution for the six DMR categories are shown in Supplemental Figures S35 and S36, respectively.
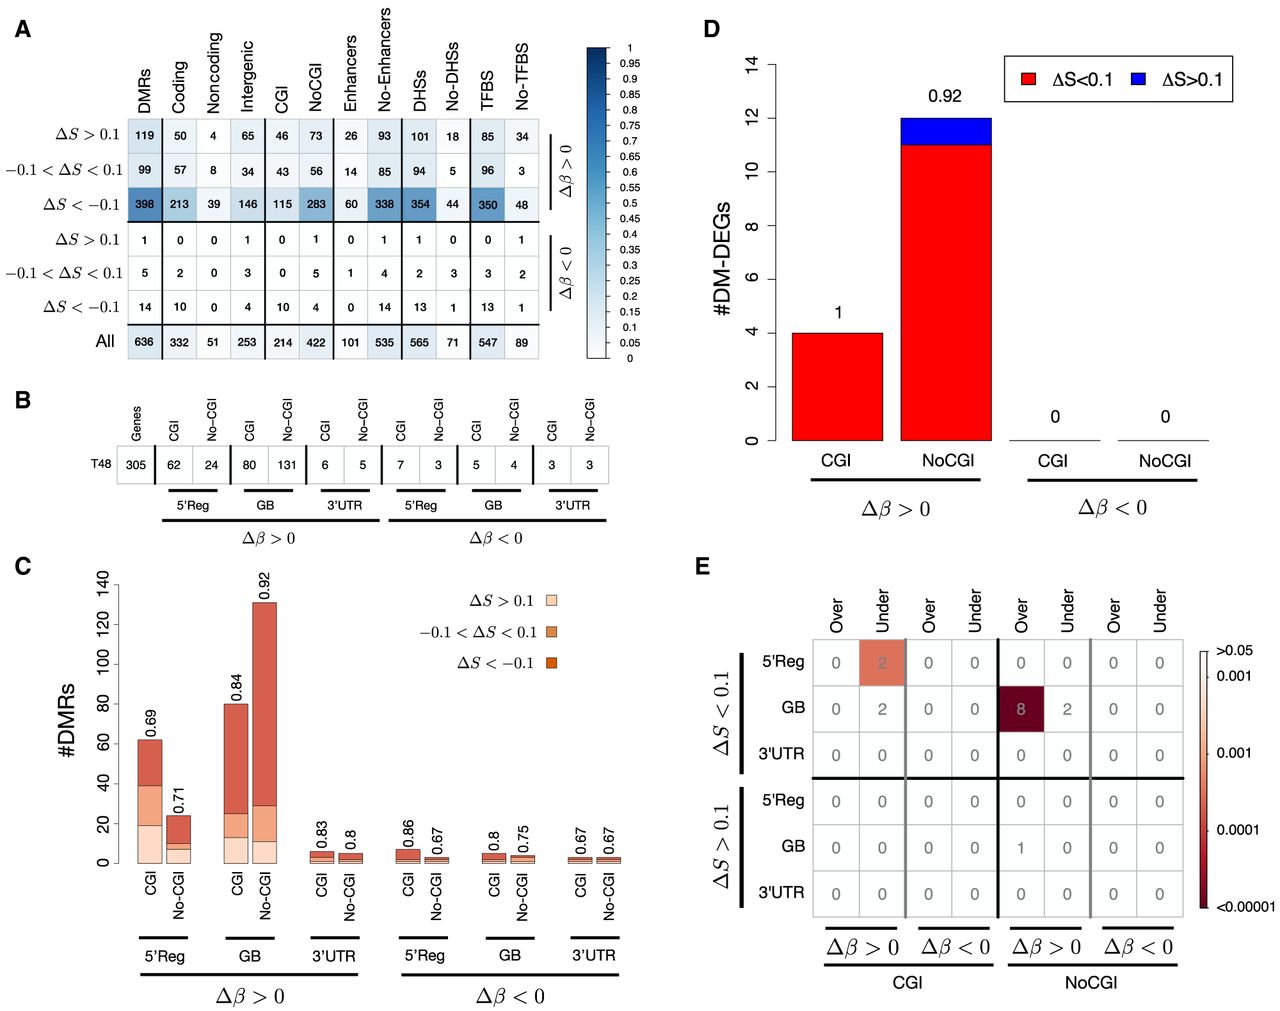
DMRs of the HPGC samples. (A) The number of DMRs identified for each of the six categories defined by Δβ and ΔS values. The plot reports the number of DMRs overlapping each genic (coding, noncoding, and intergenic) and regulatory (CGI, enhancer, DHS, TFBS) element class, and the color intensity in each cell reflects the proportion of DMRs of a category with respect to all DMRs according to the colorbar. (B) The number of DMGs affected by hypermethylated (Δβ > 0.2) and hypomethylated (Δβ < −0.2) DMRs overlapping different genic features (5′Reg, GB, and 3′ UTR), outside and inside CGIs. The bar plot in C displays the number of DMGs reported in B, further categorized as hyperentropic (ΔS > 0.1), isoentropic (−0.1 < ΔS < 0.1), and hypoentropic (ΔS < −0.1). (D) The proportion of DM-DEGs with hyperentropic (ΔS > 0.1) and iso- or hypoentropic (ΔS < 0.1) DMRs. Results are reported for hypermethylated (Δβ > 0.2) and hypomethylated (Δβ < −0.2) DMRs overlapping CGIs and outside CpG islands (NoCGI). (E) The results of ORA for DM-DEGs. The analysis was performed separately for genes affected by DMRs at the 5' regulatory region (5'Reg), the gene body (GB), and the 3' UTR and for DMRs overlapping CpG islands (CGI) and outside CpG islands (NoCGI). The blocks of the corrplot report the results of ORA for different classes of DMRs formation: Δβ > 0.2 and ΔS < 0.1 (hypermethylated and hypo- and isoentropic), Δβ > 0.2 and ΔS > 0.1 (hypermethylated and hypo- and isoentropic), Δβ < −0.2 and ΔS < 0.1 (hypomethylated and hypo- and isoentropic), Δβ < −0.2 and ΔS > 0.1 (hypomethylated and hypo- and isoentropic). The numbers in each cell represent the total number of DM-DEGs for each category, and the color intensity reflects statistical significance according to colorbar.
DMRs were then annotated with the annotation module of PoreMeth2, and we found that mapped within annotated protein-coding genes (332), in noncoding genes (51), and in intergenic regions (253). As in previous section, we found that the great majority of DMRs overlapped DHSs (88%) and TFBSs (86%), whereas only a small fraction with enhancers (16%). As expected from the DMRs’ CpG density distribution, only mapped with CGIs, whereas the remaining overlapped low-density CpG regions (Fig. 4A).
We then used the annotation module of PoreMeth2 to classify protein-coding genes affected by DMRs (DMGs) in three main functional categories: 5′Reg, 3′ UTR, and GB. The total number of DMGs is 305, nearly all of which have a hypermethylated DMR in the 5′Reg or GB (86 in 5′Reg and 211 in GB) (Fig. 4B). DMGs with hypermethylated DMRs in 5′Reg mainly involved CGIs (62 in CGI vs. 24 in NoCGI), whereas DMG with hypermethylated DMRs at GB mostly overlapped sparse CpGs (131 in NoCGI vs. 80 in CGIs). The vast majority of DMGs exhibit hypoentropic (ΔS < −0.1) or isoentropic (−0.1 < ΔS < 0.1) changes, especially those with DMRs in the GB within low-density CpG regions, in which hypoentropic DMRs account for ∼80% (Fig. 4C).
To study the impact of methylation on gene expression, we conducted quadruplicate RNA-seq experiments for the T0 and T48 samples using ONT sequencing and then analyzed differential expression with DESeq2 (see Methods) (Supplemental Table 6) and correlated with differential methylation. Only a small fraction of DMGs are also DEGs, and these consist solely of DMGs with hypermethylated DMRs (Supplemental Fig. S37). Almost all DM-DEGs showed hypoentropic (ΔS < −0.1) or isoentropic (−0.1 < ΔS < 0.1) epiallelic changes (Fig. 4D).
Finally, we analyzed the proportion of DM-DEGs with respect to all DEGs, and we found that only DMGs with hypo- and isoentropic DMRs (ΔS < 0.1, at 5′Reg in CGI and at GB in low-density CpG regions) are significantly enriched in DEGs (Fig. 4E). These results further demonstrate that our new computational approach, through the use of differential entropy, can distinguish between DMRs that have a direct impact on gene expression and those that have a weak effect on transcriptional activity.
Discussion
In this work, we present a novel computational method for the identification of DMRs and the simultaneous estimation of their potential mechanisms of origin from read-level methylation data obtained through LRS of two samples, test and control, that are evolutionarily related. Such evolutionarily related samples could include, for instance, healthy cells and tumor cells derived from the same tissue, tumors at diagnosis versus relapse, or cells before and after pharmacological treatment. Our approach combines methylation frequency (Δβ), to detect increases or decreases of methylation levels, with methylation entropy (ΔS), to measure variations in epiallelic composition.
Our computational strategy consists in jointly segmenting Δβ and ΔS signals by means of a BiSLM algorithm to identify consecutive CpG dinucleotides that show increases or decreases in their mean values. Synthetic analyses demonstrated that our approach requires sequencing coverages larger than 20× to correctly identify DMRs with as few as five consecutive CpG and to predict their epiallelic change. Furthermore, benchmarking BiSLM against Modkit and BSmooth showed its superior performance not only in detecting DMRs across the entire tested range of CpG numbers (from five to 50) but also in precisely defining their boundaries.
The BiSLM algorithm has been packaged in an R library (PoreMeth2) that also includes functions for DMRs annotation with respect to both genic and regulatory elements. The annotation function can annotate all the genic elements overlapping a DMR and can calculate the overlap with regulatory features for each genic element (such as CGI, enhancers, TFBS, and DHSs), thus allowing a better interpretation of the functional effect of methylation alterations.
To demonstrate the power of the PoreMeth2 pipeline, we first applied it to the analysis of three AML sample pairs at diagnosis (T) and relapse (R) that we previously analyzed (Magi et al. 2023b), and we compared its performance with Modkit and BSmooth. PoreMeth2 outperformed Modkit and BSmooth in the analysis of the AML data set, identifying a larger number of reliable DMRs across a broad range of CpG densities and methylation changes capturing a wider spectrum of biologically relevant alterations.
PoreMeth2 identified around 3000 DMRs for each pair of samples with a significantly larger fraction of hypermethylated versus hypomethylated. In accordance with the results obtained previously (Magi et al. 2023b), ∼70% of DMRs showed a CpG density of two or fewer CpGs per 100 bp, demonstrating that LRS coupled to our novel computational method allows the identification of epiallelic changes at an unprecedented resolution, extending analyses of high-density CpG regions (CGIs), as achieved until now, to sparse CpGs.
As in the work of Magi et al. (2023b), annotation of DMRs showed that the involvement of sparse CpGs was predominant in genes hypermethylated at GB and that only DMGs with hypermethylated DMRs at sparse CpGs in GB have a statistically significant impact on gene expression across the three samples. DMRs with ΔS < 0.1 (hypo- and isoentropic) have the highest impact on gene expression, whereas hyperentropic DMRs have a marginal effect.
As a further step, we used PoreMeth2 to analyze an ONT data set of HPGC cells before and after treatment with a G protein–coupled receptor agonist. BiSLM between treated and nontreated cells identified 636 DMRs, mostly hypermethylated and with the majority being iso- or hypoentropic.
About 50% of DMRs mapped to protein-coding genes, and most DMGs had hypermethylated DMRs in 5′Regs or GBs. Only a small fraction of DMGs were also DEGs, and almost all DM-DEGs were hypoentropic (ΔS < −0.1) or isoentropic (0.1 < ΔS < 0.1), suggesting that these epiallelic alterations may exert a significant effect on gene expression.
These results demonstrate that our approach enables the differentiation of epigenomic alterations potentially arising from the selection of epialleles with a direct effect on gene expression as opposed to those generated by the random rearrangement of epialleles with a minimal impact on gene expression.
Although PoreMeth2 was primarily designed to compare evolutionarily related samples, this does not imply that the tool cannot be applied to data sets derived from unrelated tissues or samples. Rather, it means that in such cases the ΔS value does not provide information about the possible mechanism underlying the formation of the DMR. Nevertheless, even when analyzing samples that are not evolutionarily related, ΔS can still indicate homogenization or heterogenization of the epiallelic composition between samples. For example, a partially methylated domain in one sample may correspond to a fully methylated or fully unmethylated region in another.
In conclusion, PoreMeth2 is the first computational pipeline that is capable of exploiting the intrinsic characteristics of long-read data to study methylation at an unprecedented resolution and is compatible with both ONT data, on which it was developed and tested, and data generated by other LRS platforms, such as Pacific Biosciences (PacBio) SMRT sequencing. Moreover, the data generated by ONT devices can also be applied to other DNA modifications, such as 5hmC and 6mA. Currently, we are testing PoreMeth2 in the analysis of 5hmC profiles in liquid and solid cancers.
Methods
Bivariate SLM algorithm
SLM are a special class of hidden Markov models in which sequential observations x = (x1, …, xi, …, xN) are considered to be realizations of the sum of two independent stochastic processes xi = mi + εi, where mi is the unobserved mean level, and εi is normally distributed white noise.
To jointly segment ΔS and Δβ values of consecutive CpG dinucleotide, we extended the classical SLM model to a bivariate version, where xi = (ΔSi, Δβi), mi = (mi1, mi2), and εi is the vector of white noises, and it follows a bivariate normal distribution with mean με = [0, 0] and covariance matrix Σε ().
The mean level mi does not change for long intervals, and its duration follows a geometric distribution: The probability that mi takes a new value at any point i is regulated by the parameter η, and when it changes, mi is incremented by the normal random variable δi () (for more details, see Supplemental Material).
PoreMeth2
PoreMeth2 is an R (R Core Team 2022) package for the identification of DMRs from LRS methylation data of paired samples. It takes as input the methylation calls inferred by tools such as Nanopolish, Guppy, or Dorado from a pair of test and matched normal samples and automatically identifies statistically significant DMRs.
DMRs identification is performed by simultaneously segmenting Δβ and ΔS values of each CpG dinucleotide using the BiSLM algorithm. DMRs can then be automatically annotated to genic (promoter, introns, exons) and regulatory features (CGIs, enhancers, TFBSs, and DHSs) to evaluate their functional impact.
The genic elements of PoreMeth2 were generated by parsing the GENCODE project annotation data (release 46 for GRCh38 and release 19 for GRCh37; https://ftp.ebi.ac.uk/pub/databases/gencode/). Consequently, PoreMeth2 contains the annotation of a large number of possible biotypes that include protein-coding genes, long noncoding RNAs, pseudogenes, and small RNAs.
For each gene/transcript, PoreMeth2 considers the longest transcript with the highest number of exons, and the gene model annotations include Promoter (1 kb upstream of the TSS), first exons, internal exons, internal introns, and last exons. CGIs, DHSs, and TFBS genomic coordinates were downloaded from UCSC Table Browser (https://genome.ucsc.edu/cgi-bin/hgTables). Enhancers coordinates were downloaded from FANTOM5 (https://fantom.gsc.riken.jp/5/).
PoreMeth2 also contains functions to evaluate the quality of methylation data generated by nanopore sequencing. Given the importance of coverage and data quality to obtain a high resolution in DMRs detection, as previously discussed, we implemented two functions to help visualize statistics about the input data.
The function PoreMeth2SingleExpQualityPlot returns four plots representing the distribution of β and S values across CpGs genomic positions in a sample and the distribution of the number of reads used to calculate them (Supplemental Fig. S38).
The function PoreMeth2PairedExpQualityPlot returns two plots representing the distribution of the number of reads used to calculate Δβ and ΔS for common CpGs between the two samples (Supplemental Fig. S39).
AML sample sequencing and data preparation
DNA from each of three pairs of matched AMLs was sequenced, basecalled, and aligned to the human reference genome (hg19) as in the work of Magi et al. (2023b). The use of hg19 instead of more recent reference genome versions does not substantially affect the number or distribution of CpG sites and therefore does not impact the significance of the results. 5mC were inferred with Nanopolish (v. 0.8.5) (Simpson et al. 2017) by using log likelihood ratios (<−2 or >2, as suggested in GitHub). Chromosomes X and Y have been excluded from subsequent analyses. DMR detection has been performed with PoreMeth2 as well as the Modkit (version 0.4.1) dmr pair function and BSmooth algorithm (using the R package bsseq, version 1.44) in order to compare the performance of the BiSLM algorithm with other methylation segmentation methods.
RNA from each of three pairs of matched AMLs was sequenced as previously described (Magi et al. 2023b) with the Illumina NovaSeq 6000 platform. Transcript counts from paired-end reads were performed with Salmon v. 0.14.1 and the reference transcriptome GRCh37 from Ensembl. Normalization and statistical analysis were performed with DESeq2 (v. 1.30.1). DEGs with adjusted P-value < 0.05, as scored by the Benjamin–Hopkins formula, and absolute log2FC > 0.5 were selected. DNA and RNA nanopore sequencing data for AML samples, generated previously (Magi et al. 2023a), are available in FASTQ format in the NCBI BioProject database (https://www.ncbi.nlm.nih.gov/bioproject/) under accession numbers PRJNA879930 and PRJNA879971, respectively.
HPGC sample sequencing and data preparation
DNA libraries from T0 and T48 were sequenced with r9.4.1 ONT flowcells on the P2 Solo ONT instrument with a 72 h acquisition time for each sequencing run.
We used Guppy (v. 6.5.7) with super high accuracy model to obtain basecalls and modified basecalls.
Alignment to the human reference genome (hg19, for consistency with the AML data set) has been performed by Guppy itself by means of the integrated minimap2 version (2.24) (Li 2018). Chromosomes X and Y have been excluded from subsequent analyses. Read-level 5mCG likelihoods were extracted using Modkit (https://github.com/nanoporetech/modkit, v. 0.4.1), and methylation status was inferred following Modkit guidelines (https://github.com/nanoporetech/modkit/blob/master/book/src/filtering_details.md).
cDNA quadruplicates from RNA extraction were sequenced with r9.4.1 flowcells on a P2 Solo ONT instrument with a 72 h acquisition time. Basecalling and alignment were performed with Guppy (v. 6.5.7). The featureCounts function from the Bioconductor package Rsubread (v 2.12.3) (Liao et al. 2019) was used to calculate transcript count matrices, whereas normalization and differential expression analysis were performed with DESeq2. DEGs with adjusted P-value < 0.05 and absolute log2FC > 0.5 were selected.
Overrepresentation analysis
Pathways for ORA were selected by the network of “Pathways in Cancer” of the KEGG database and the Oncogenic Signaling Pathways in The Cancer Genome Atlas (TCGA) 62. Gene lists of these pathways were downloaded from https://www.kegg.jp/kegg/download/ (KEGG), COSMIC genes from https://cancer.sanger.ac.uk/cosmic/file_download, and GEAR genes from http://gear.comp-sysbio.org, TF from http://regnetworkweb.org/. ORA was performed by using Fisher's exact test using the list of all UCSC genes as background.
Software availability
PoreMeth2 is available from GitHub (https://github.com/Lab-CoMBINE/PoreMeth2) and as Supplemental Code.
Data access
RNA-seq counts and methylation frequency and entropy data generated in this study have been submitted to the NCBI Gene Expression Omnibus (GEO; https://www.ncbi.nlm.nih.gov/geo/) under accession number GSE277456. Nanopore whole-genome sequencing (WGS) and RNA-seq data for HPGCs generated in this study have been submitted to the NCBI BioProject database (https://www.ncbi.nlm.nih.gov/bioproject/) under accession number PRJNA1160066.
Competing interest statement
A. Magi and G.M. have received travel funding for presenting at symposia organized by ONT and for a poster presentation, respectively.
Acknowledgments
We acknowledge financial support under the National Recovery and Resilience Plan (NRRP), mission 4, component 2, investment 1.1, call for tender No. 104 published on February 2, 2022, by the Italian Ministry of University and Research (MUR), funded by the European Union–NextGenerationEU–Project Title Computational Methods for Third Generation Cancer Genomics–CUP B53D23007820006–grant assignment decree no. n. 970 adopted on June 30, 2023, by the Italian Ministry of Ministry of University and Research (MUR). Views and opinions expressed are, however, those of the authors only and do not necessarily reflect those of the European Union or the European Commission. Neither the European Union nor the European Commission can be held responsible for them. This work was also supported under the National Recovery and Resilience Plan (PNRR), Mission 4, Component 2, Investment 1.5 (CUP B83C22003920001), within Spoke 3, Subproject 14 “A Computational Platform for Future Diagnostics.” This work was also funded by the European Union - Next Generation EU - NRRP M6C2 - Investment 2.1 Enhancement and strengthening of biomedical research in the National Health Service (NHS). We thank the three anonymous reviewers for their insightful comments and constructive suggestions, which helped us improve the clarity and overall value of the manuscript.
Notes
[1] Supplementary material [Supplemental material is available for this article.]
[2] Article published online before print. Article, supplemental material, and publication date are at https://www.genome.org/cgi/doi/10.1101/gr.280259.124.
References
- ↵Batra RN, Lifshitz A, Vidakovic AT, Chin S-F, Sati-Batra A, Sammut S-J, Provenzano E, Ali HR, Dariush A, Bruna A, 2021. DNA methylation landscapes of 1538 breast cancers reveal a replication-linked clock, epigenomic instability and cis-regulation. Nat Commun 12: 5406. 10.1038/s41467-021-25661-w
- ↵Beck D, Maamar MB, Skinner MK. 2022. Genome-wide CpG density and DNA methylation analysis method (MeDIP, RRBS, and WGBS) comparisons. Epigenetics 17: 518–530. 10.1080/15592294.2021.1924970
- ↵Bhasin JM, Ting AH. 2016. Goldmine integrates information placing genomic ranges into meaningful biological contexts. Nucleic Acids Res 44: 5550–5556. 10.1093/nar/gkw477
- ↵Cavalcante RG, Sartor MA. 2017. annotatr: genomic regions in context. Bioinformatics 33: 2381–2383. 10.1093/bioinformatics/btx183
- ↵Clarke J, Wu HC, Jayasinghe L, Patel A, Reid S, Bayley H. 2009. Continuous base identification for single-molecule nanopore DNA sequencing. Nat Nanotechnol 4: 265–270. 10.1038/nnano.2009.12
- ↵Heinz S, Benner C, Spann N, Bertolino E, Lin YC, Laslo P, Cheng JX, Murre C, Singh H, Glass CK. 2010. Simple combinations of lineage-determining transcription factors prime cis-regulatory elements required for macrophage and B cell identities. Mol Cell 38: 576–589. 10.1016/j.molcel.2010.05.004
- ↵Jones PA, Baylin SB. 2002. The fundamental role of epigenetic events in cancer. Nat Rev Genet 3: 415–428. 10.1038/nrg816
- ↵Kalari S, Pfeifer G. 2010. Identification of driver and passenger DNA methylation in cancer by epigenomic analysis. Adv Genet 70: 277–308. 10.1016/B978-0-12-380866-0.60010-1
- ↵Kaluscha S, Domcke S, Wirbelauer C, Stadler MB, Durdu S, Burger L, Schübeler D. 2022. Evidence that direct inhibition of transcription factor binding is the prevailing mode of gene and repeat repression by DNA methylation. Nat Genet 54: 1895–1906. 10.1038/s41588-022-01241-6
- ↵Kanehisa M, Goto S. 2000. KEGG: Kyoto Encyclopedia of Genes and Genomes. Nucleic Acids Res 28: 27–30. 10.1093/nar/28.1.27
- ↵Kupkova K, Mosquera JV, Smith JP, Stolarczyk M, Danehy TL, Lawson JT, Xue B, Stubbs JTIV, LeRoy N, Sheffield NC. 2022. GenomicDistributions: fast analysis of genomic intervals with Bioconductor. BMC Genomics 23: 299. 10.1186/s12864-022-08467-y
- ↵Lambert SA, Jolma A, Campitelli LF, Das PK, Yin Y, Albu M, Chen X, Taipale J, Hughes TR, Weirauch MT. 2018. The human transcription factors. Cell 172: 650–665. 10.1016/j.cell.2018.01.029
- ↵Li H. 2018. Minimap2: pairwise alignment for nucleotide sequences. Bioinformatics 34: 3094–3100. 10.1093/bioinformatics/bty191
- ↵Liao Y, Smyth GK, Shi W. 2019. The R package Rsubread is easier, faster, cheaper and better for alignment and quantification of RNA sequencing reads. Nucleic Acids Res 47: e47. 10.1093/nar/gkz114
- ↵Love MI, Huber W, Anders S. 2014. Moderated estimation of fold change and dispersion for RNA-seq data with DESeq2. Genome Biol 15: 550. 10.1186/s13059-014-0550-8
- ↵Magi A, Giusti B, Tattini L. 2017. Characterization of MinION nanopore data for resequencing analyses. Brief Bioinform 18: 940–953. 10.1093/bib/bbw077
- ↵Magi A, Semeraro R, Mingrino A, Giusti B, D'Aurizio R. 2018. Nanopore sequencing data analysis: state of the art, applications and challenges. Brief Bioinform 19: 1256–1272. 10.1093/bib/bbx062
- ↵Magi A, Mattei G, Mingrino A, Caprioli C, Ronchini C, Frigè G, Semeraro R, Baragli M, Bolognini D, Colombo E, 2023a. GASOLINE: detecting germline and somatic structural variants from long-reads data. Sci Rep 13: 20817. 10.1038/s41598-023-48285-0
- ↵Magi A, Mattei G, Mingrino A, Caprioli C, Ronchini C, Frigè G, Semeraro R, Bolognini D, Rambaldi A, Candoni A, 2023b. High-resolution nanopore methylome-maps reveal random hyper-methylation at CpG-poor regions as driver of chemoresistance in leukemias. Commun Biol 6: 382. 10.1038/s42003-023-04756-8
- ↵R Core Team. 2022. R: a language and environment for statistical computing. R Foundation for Statistical Computing, Vienna. https://www.R-project.org/.
- ↵Rhoads A, Au KF. 2015. PacBio sequencing and its applications. Genomics Proteomics Bioinformatics 13: 278–289. 10.1016/j.gpb.2015.08.002
- ↵Robinson JT, Thorvaldsdóttir H, Winckler W, Guttman M, Lander ES, Getz G, Mesirov JP. 2011. Integrative genomics viewer. Nat Biotechnol 29: 24–26. 10.1038/nbt.1754
- ↵Simpson JT, Workman RE, Zuzarte PC, David M, Dursi LJ, Timp W. 2017. Detecting DNA cytosine methylation using nanopore sequencing. Nat Methods 14: 407–410. 10.1038/nmeth.4184
- ↵Sun Z, Cunningham J, Slager S, Kocher JP. 2015. Base resolution methylome profiling: considerations in platform selection, data preprocessing and analysis. Epigenomics 7: 813–828. 10.2217/epi.15.21
- ↵Tate JG, Bamford S, Jubb HC, Sondka Z, Beare DM, Bindal N, Boutselakis H, Cole CG, Creatore C, Dawson E, 2019. COSMIC: the catalogue of somatic mutations in cancer. Nucleic Acids Res 47: D941–D947. 10.1093/nar/gky1015
- ↵Wang YY, Chen WH, Xiao PP, Xie WB, Luo Q, Bork P, Zhao XM. 2017. GEAR: a database of genomic elements associated with drug resistance. Sci Rep 7: 44085. 10.1038/srep44085
- ↵Xie H, Wang M, de Andrade A, Bonaldo MDF, Galat V, Arndt K, Rajaram V, Goldman S, Tomita T, Soares MB. 2011. Genome-wide quantitative assessment of variation in DNA methylation patterns. Nucleic Acids Res 39: 4099–4108. 10.1093/nar/gkr017