
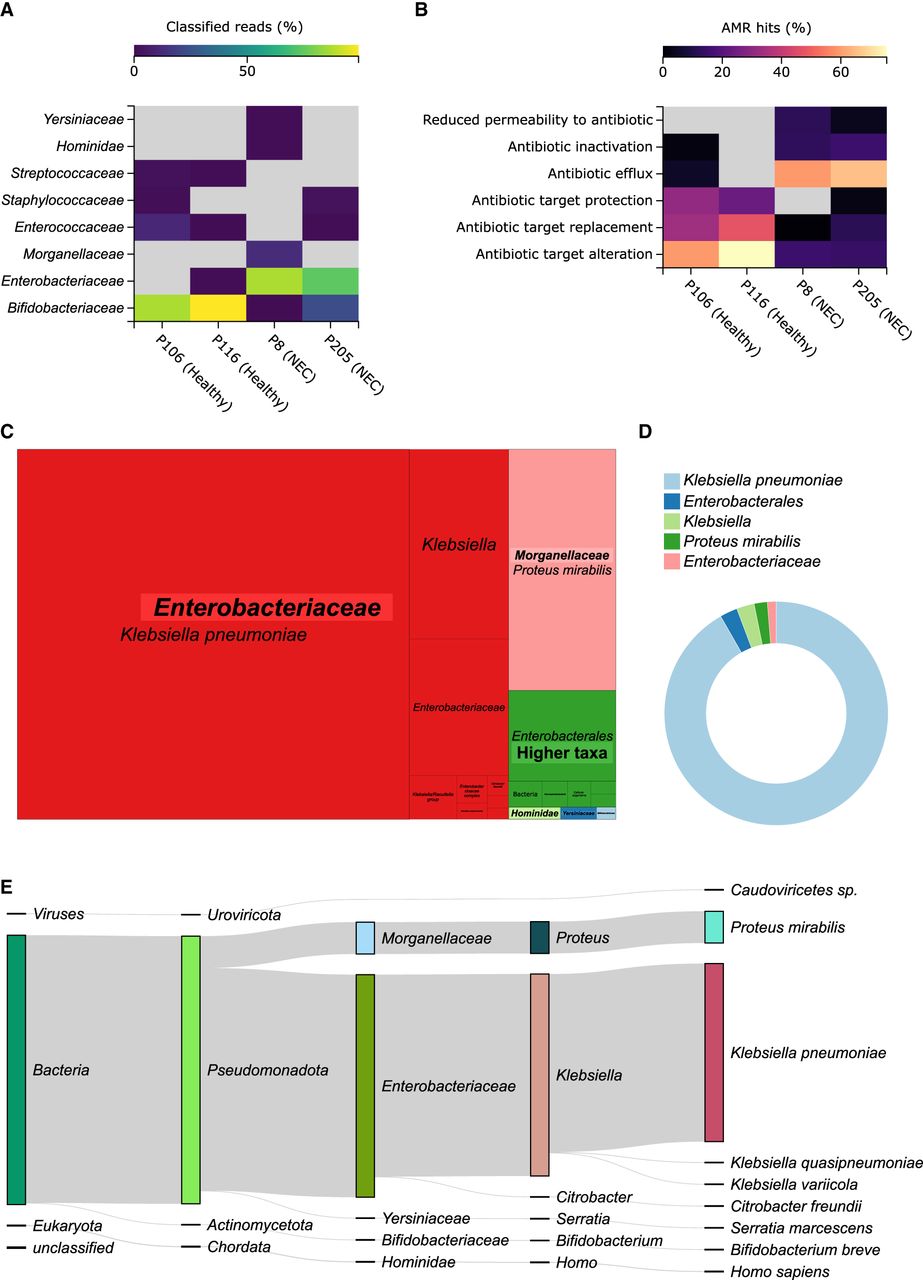
Selected MARTi GUI plots from the re-analysis of four published preterm infant microbiomes. Two of the samples were from healthy individuals (P106 and P116) and the other two from preterms clinically diagnosed with NEC (P205 and P8). (A) Family-level taxonomic classification heat map. (B) Resistance mechanism composition of the AMR hits within each sample. (C) Treemap of classified reads for P8 (an NEC sample) showing all taxonomic levels grouped by family. (D) Donut plot displaying the proportions of AMR hits for P8 that have been associated with taxa by “walkout” analysis. A 0.1% minimum LCA abundance threshold was used for all the taxonomic classification plots. (E) Sankey diagram of classified reads for P8 (an NEC sample) illustrating read assignment flows from higher to lower ranks. Plots were exported from the MARTi GUI as SVGs and arranged with Inkscape, where species and genera names were also italicized.


