
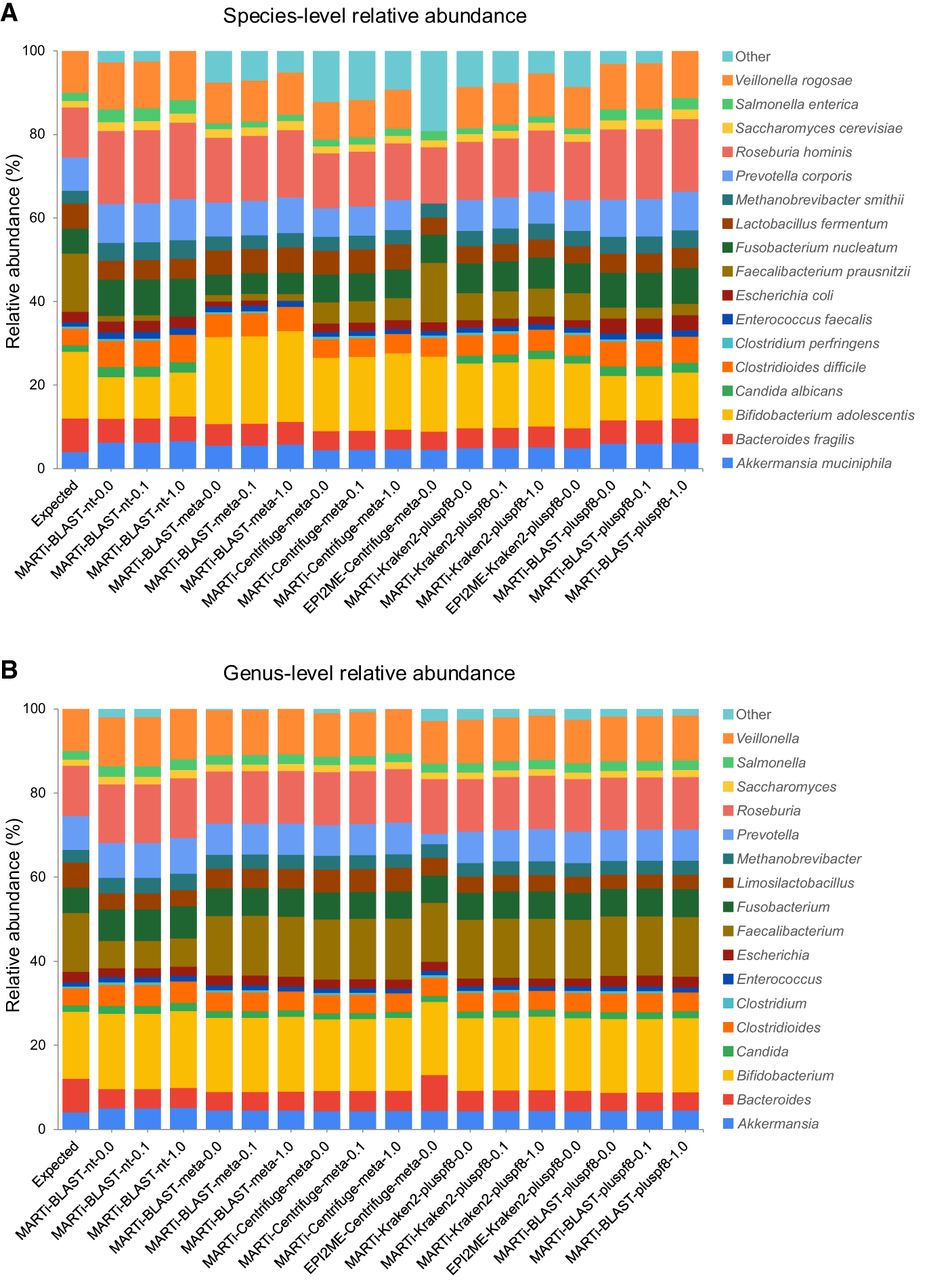
Figure 5.
Relative abundance estimates for different classification pipelines using simulated reads from a small mock microbial community at (A) species-level, and (B) genus-level. The first bar represents the expected abundances of each taxon in the mix based on read counts. False-positive classifications are grouped into “Other.”


