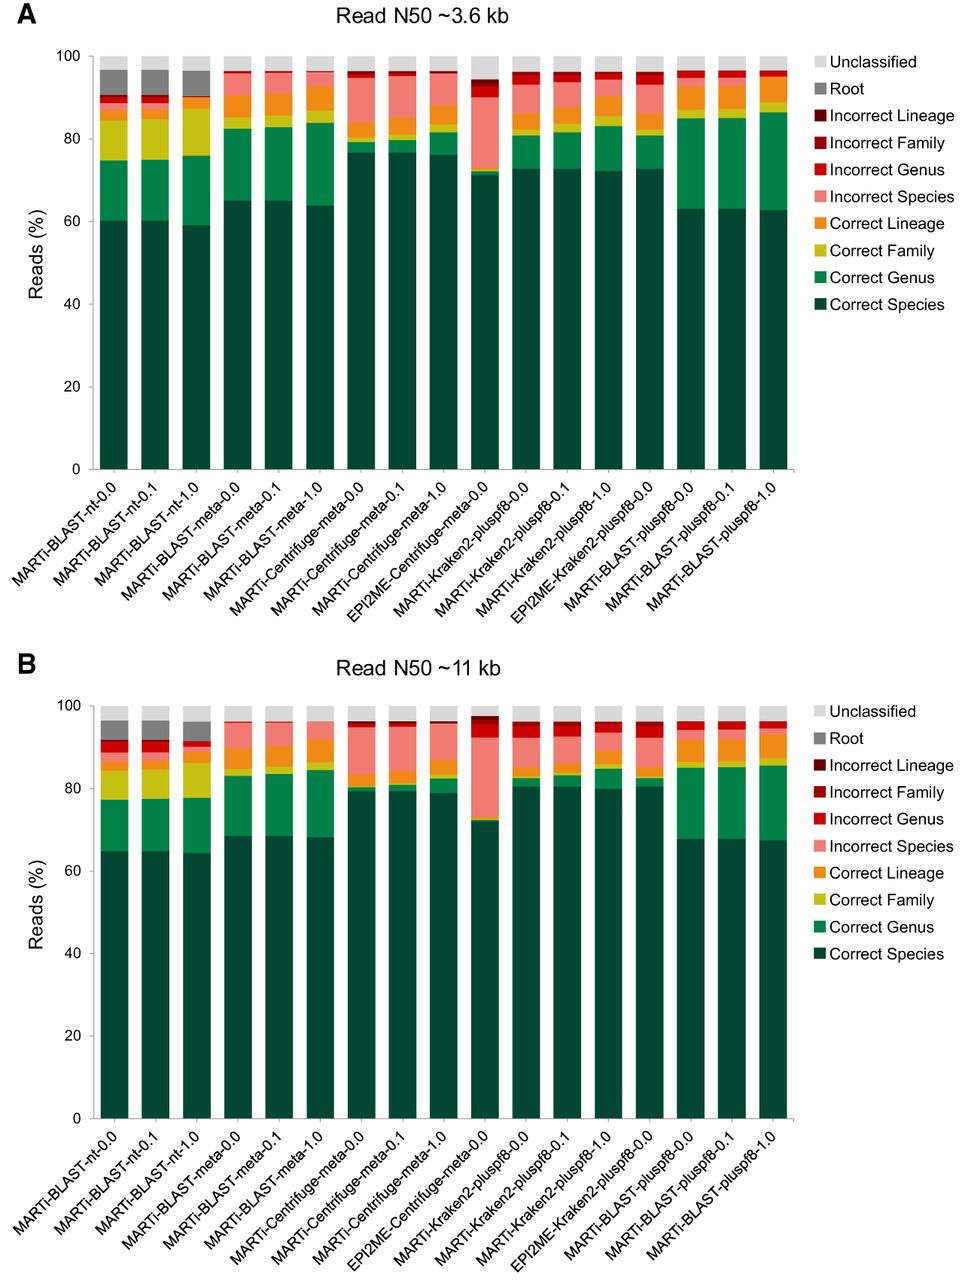
Real-time analysis and visualization of nanopore metagenomic samples with MARTi

(Downloading may take up to 30 seconds. If the slide opens in your browser, select File -> Save As to save it.)

Click on image to view larger version.

Figure 3.
Figure 3.

Read classifications for different pipelines using a small mock microbial community consisting of 100 k simulated reads. (A) Read classifications using trimmed down reads with a read N50 of ∼3.6 kb. (B) Read classification results using the longer reads, read N50 of ∼11 kb.

This Article

  1. Genome Res. 35: 2488-2500

Preprint Server