
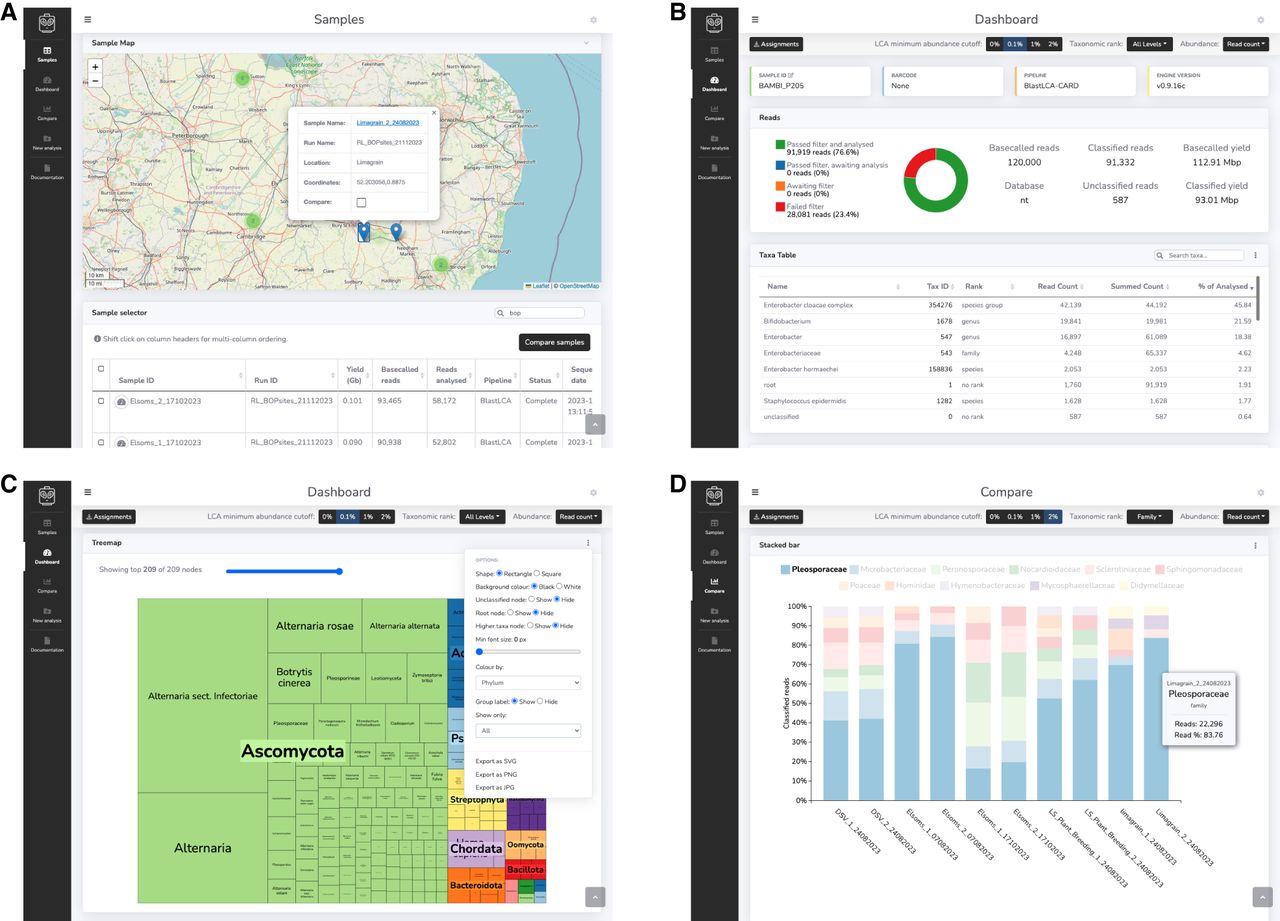
Figure 2.
The MARTi GUI. (A) The Samples page is the landing page for the interface and allows users to view and load available samples. (B) The Dashboard is for viewing results of an individual sample. (C) The Dashboard displays analysis results using various tables and interactive plots that update in real time as updates become available. Each plot has an options menu (shown here on the treemap plot) for plot customization and export buttons. (D) The Compare page can be used to compare taxonomic composition and AMR hits between samples.


