
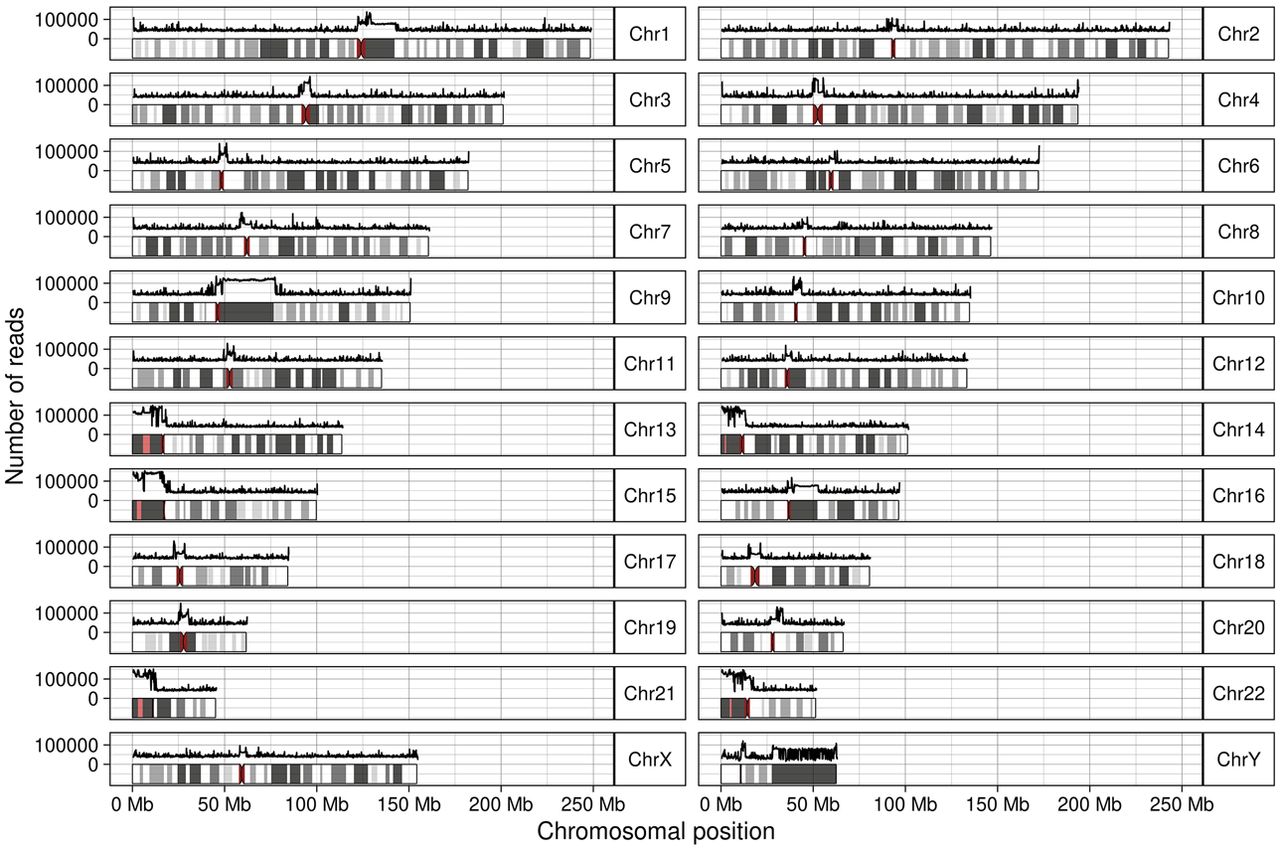
Figure 3.
Number of reads from unplaced contigs mapping across T2T-CHM13 in bins of 100 kbp. For each chromosome, an ideogram including the bands is shown; centromeres are dark red and thinner. The x-axis corresponds to the position on the chromosome. The y-axis is logarithmic and corresponds to the number of reads. The line above each chromosome shows the number of reads mapping to a 100-kbp window.


