
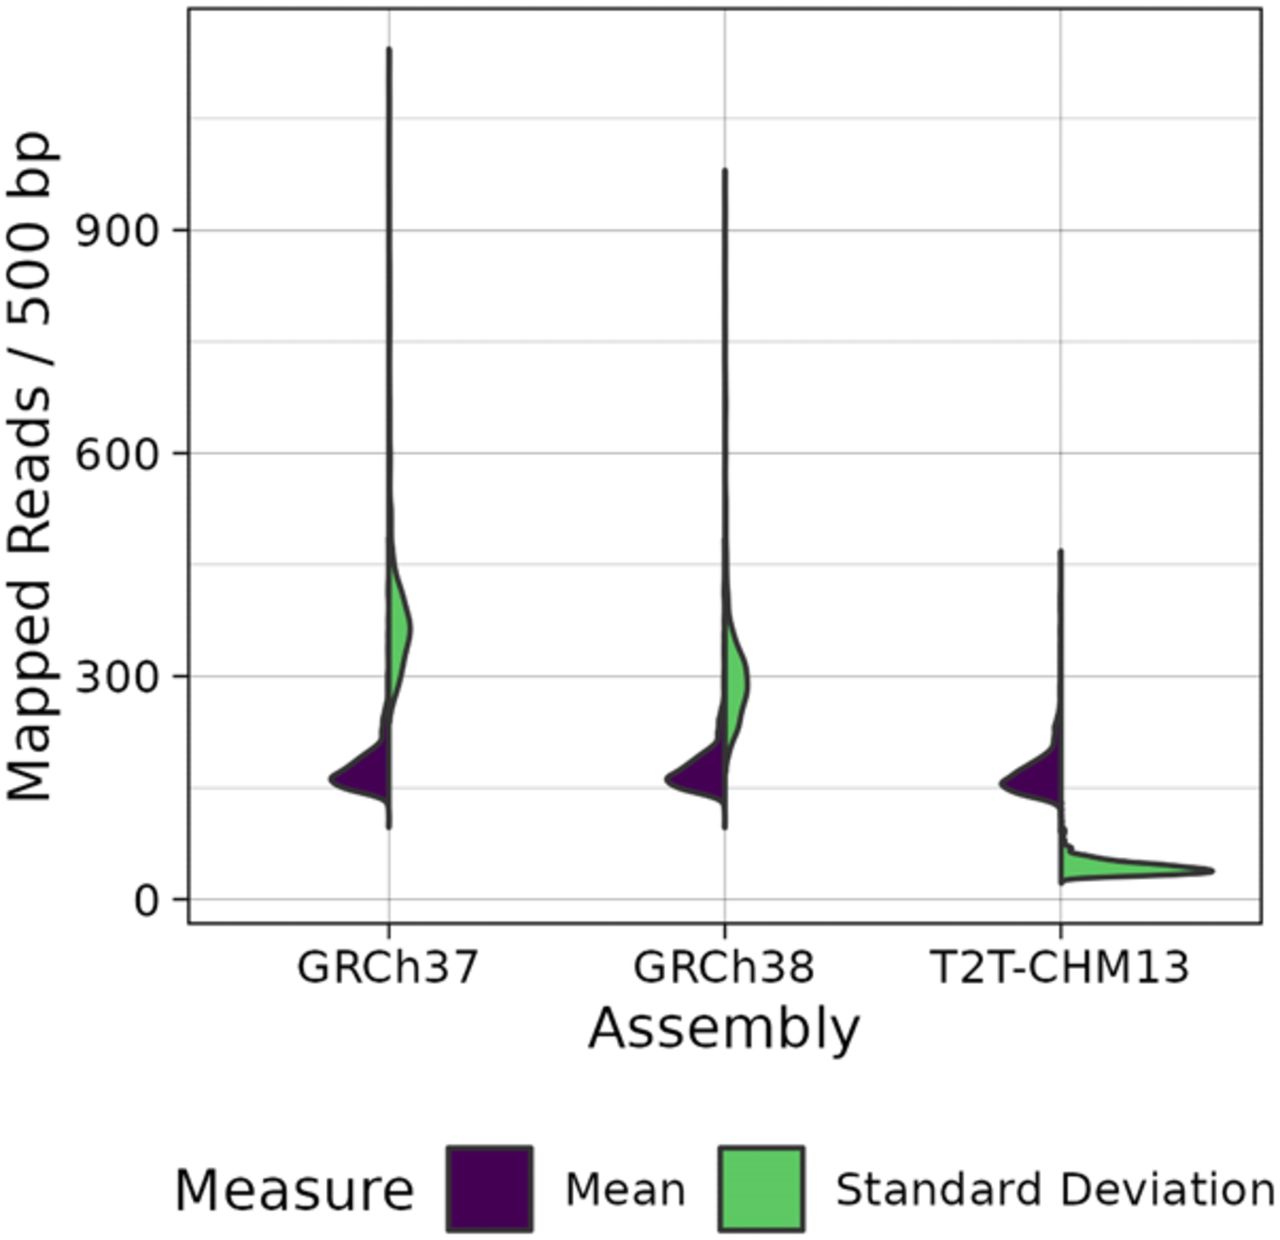
Figure 2.
Summary of read depth in gene regions. Genes were divided into nonoverlapping 500-bp bins, and the read depth of each bin was calculated. From these, per-individual means (blue, left-facing) and standard deviations (green, right-facing) were obtained, which are shown here.


