
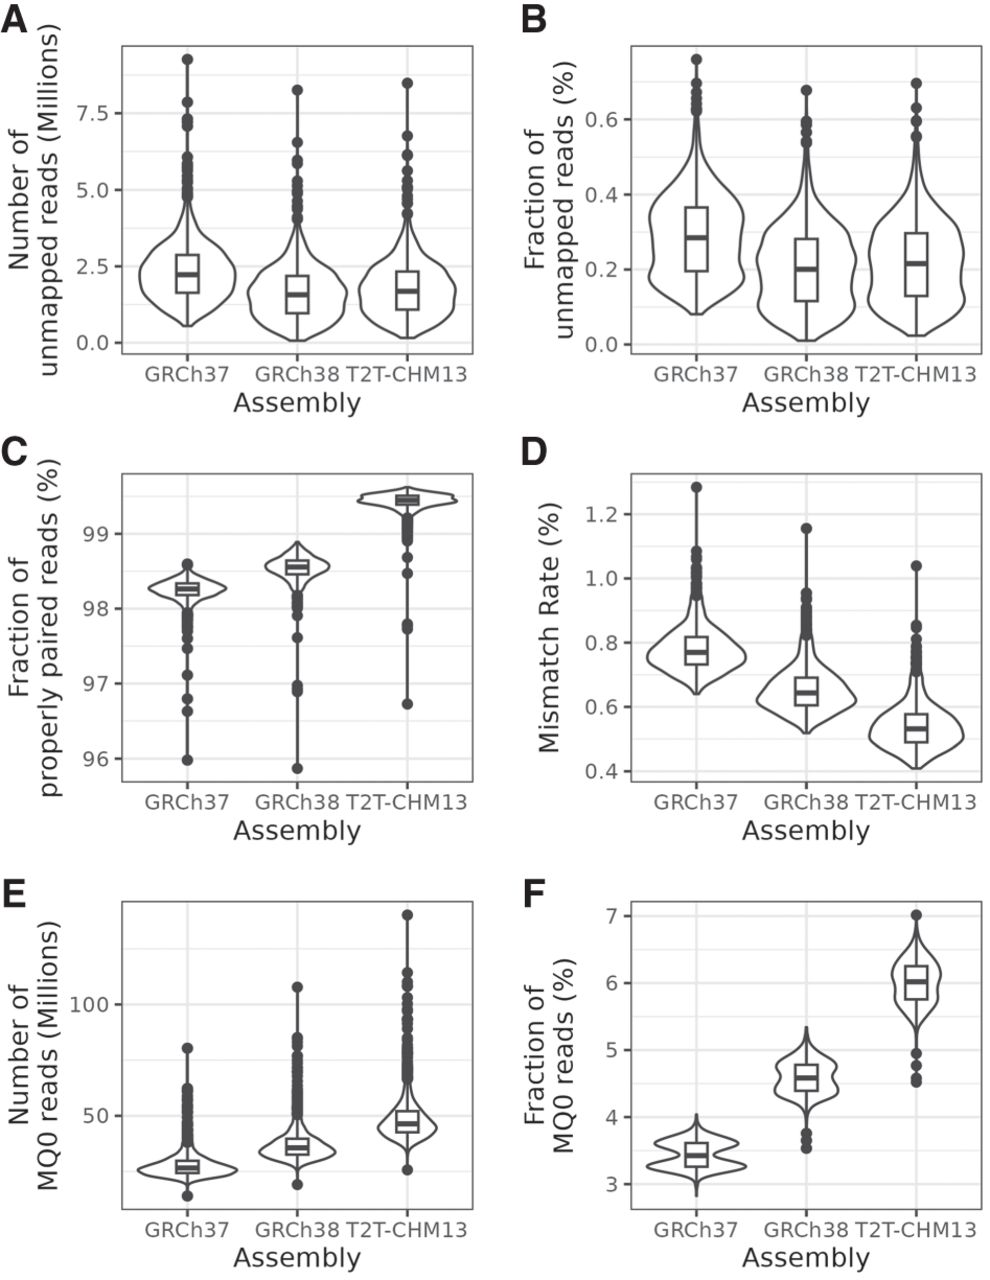
Figure 1.
General mapping statistics for all 1000 samples. (A) Distribution of the total number of unmapped reads. (B) Percentage of unmapped reads per individual. (C) Percentage of mapped read pairs that were properly paired, that is, both mates were mapped with the expected distance and orientation. (D) Mismatch rate, that is, the fraction of mapped bases that did not match the reference. (E) Number of mappings with quality 0, that is, not mapping uniquely. (F) Percentage of mappings that had quality 0. MQ0 = mapping quality 0.


