
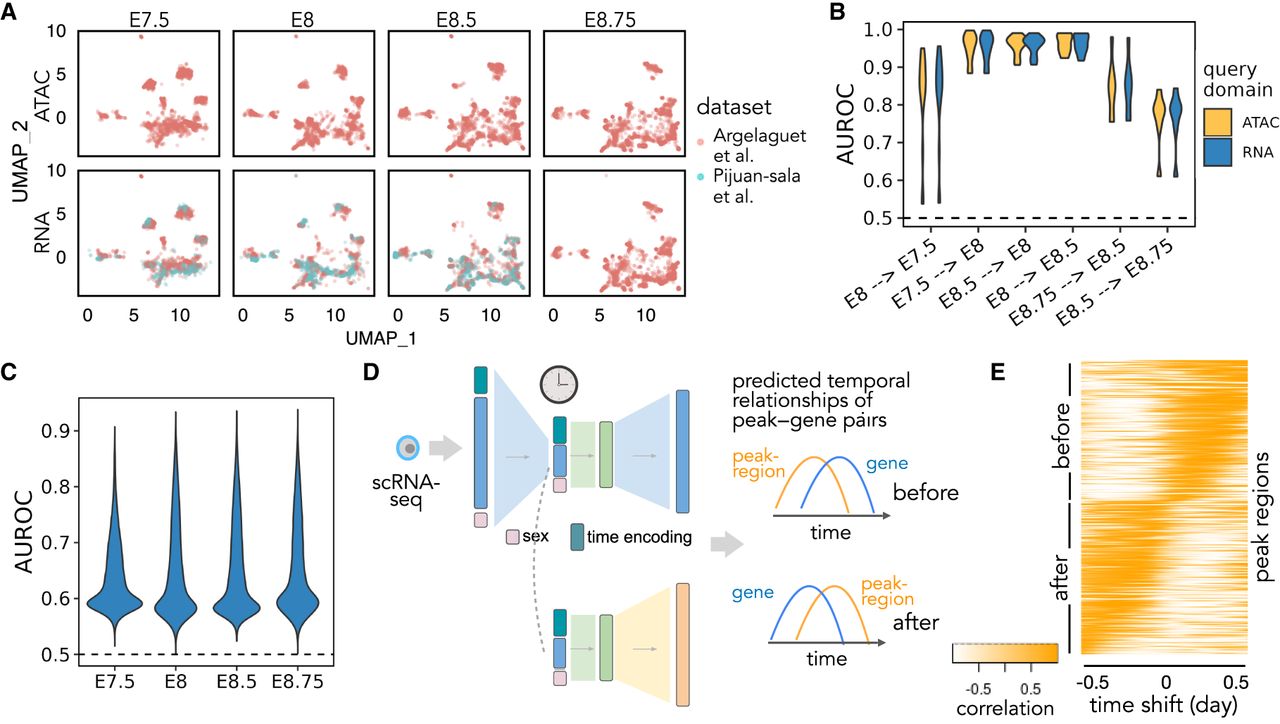
Multimodal temporal inference. (A) A UMAP embedding suggests that scRNA-seq and scATAC-seq profiles are well aligned across time and batch. Only time points with both scRNA-seq and scATAC-seq available are shown. (B) AUROC of the predicted differential accessibility pattern relative to those derived from the original data sets. AUROC is calculated per cell type, and differential accessibility is calculated between each held-out time point and each query time point (shown as “query time point → held-out time point”). (C) Peak-wise AUROC of scATAC-seq profiles predicted based on scRNA-seq relative to the original scATAC-seq profile in each held-out time point. AUROCs are calculated across all cells. (D) Workflow for calculating the dynamic association between peaks and genes. A query cell's scRNA-seq profile is fed into Sunbear to predict temporal patterns of gene expression and chromatin accessibility. For each pair of chromatin region and its proximal gene, we calculate the correlation coefficient between them with incremental time shifts, which results in a TLCC vector (column). (E) Visualization of predicted peak region–gene relationships. Heatmap of TLCC matrices on randomly selected 5000 peak regions with accessibility changes ahead of (“before”) or subsequent to (“after”) nearby gene expression. Peak regions are sorted based on the time shift with the maximum TLCC.


