
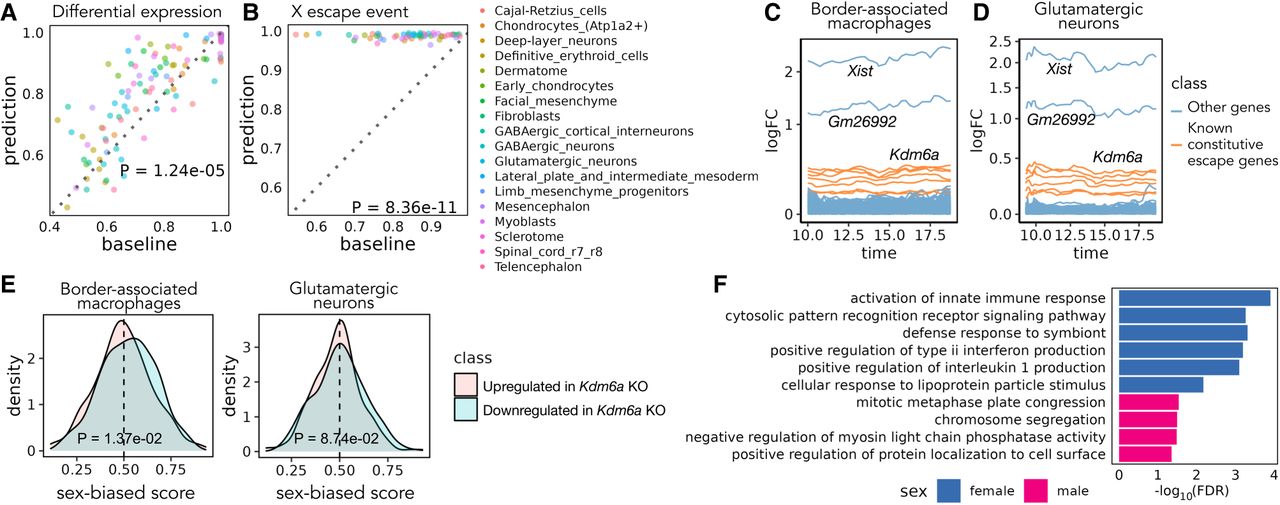
Sex differences in mouse embryonic development. (A) Pairwise comparison of Sunbear prediction and the nearest neighbor baseline in recapitulating differential expression patterns in sex-matched time points. Each dot indicates the AUROC score of recapitulating female-/male-biased patterns in each sex-matched time point and cell type. (B) Similar to in A, pairwise comparison of Sunbear prediction and the nearest neighbor baseline in ranking escape genes to be more female-biased than all other genes on the X Chromosome. (C,D) Predicted temporal sex-biased log fold change in glutamatergic neurons and border-associated macrophages. Each line represents a gene that is predicted to be consistently higher in females than males and is colored by whether the gene is a known constitutive escape gene or not. (E) Distribution of predicted sex-biased scores of genes (0 = extremely male-biased, 1 = extremely female-biased), grouped and colored by whether the gene is upregulated (pink) or downregulated (blue) in Kdm6a KO versus WT samples in CD4+ cells. P-values are calculated by one-sided Wilcoxon rank-sum tests. (F) Gene Ontology biological processes enriched in consistently female- and male-biased genes in border-associated macrophages. Nonredundant terms with the smallest FDR are selected for visualization. No enrichment of biological processes is found in glutamatergic neurons.


