
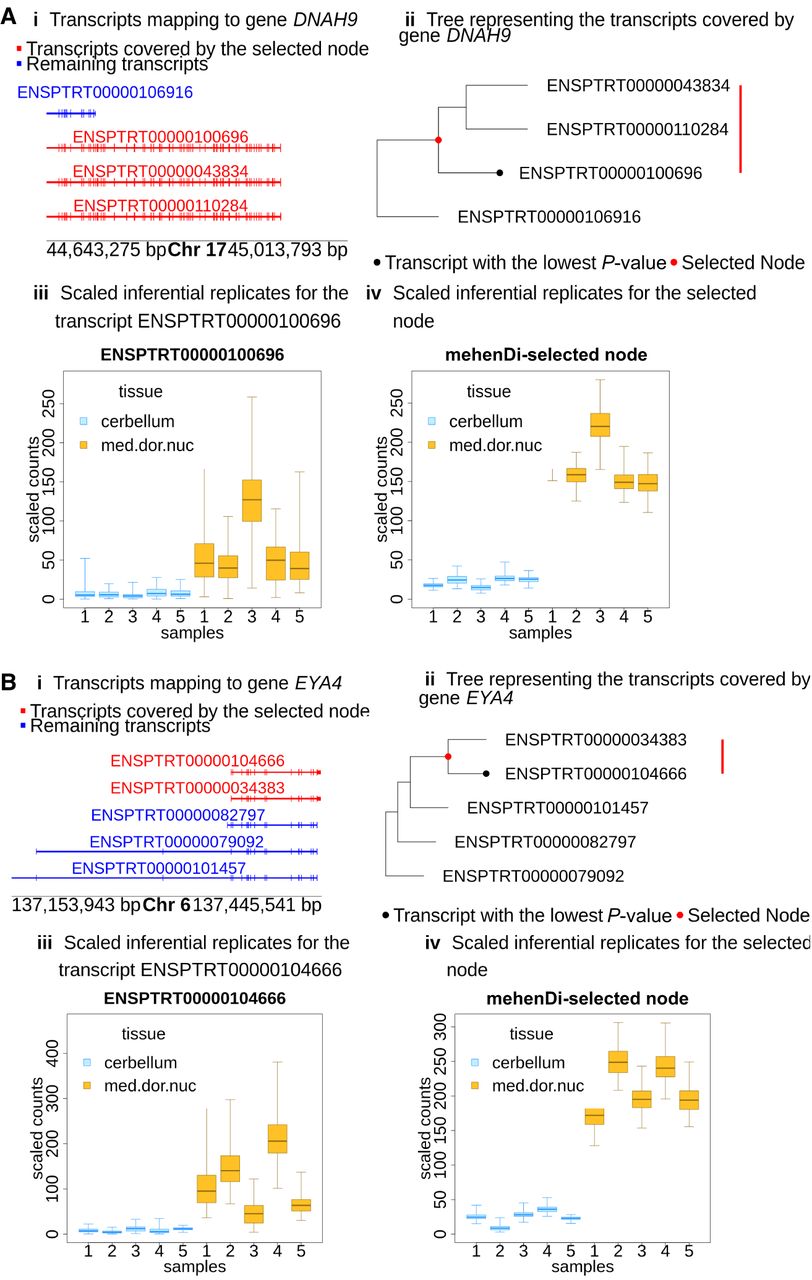
Figure 6.
Examining the transcript profile for the gene (A) DNAH9 and (B) EYA4 in the ChimpBrain data set. (i) Transcripts in a pileup style. (ii) Tree representing the transcripts covered by the gene, with the red node representing the transcripts covered by the mehenDi-selected node. (iii) Inferential replicates for the transcript with the lowest P-value among all the transcripts in the tree. (iv) Inferential replicates for the mehenDi-selected node.


