
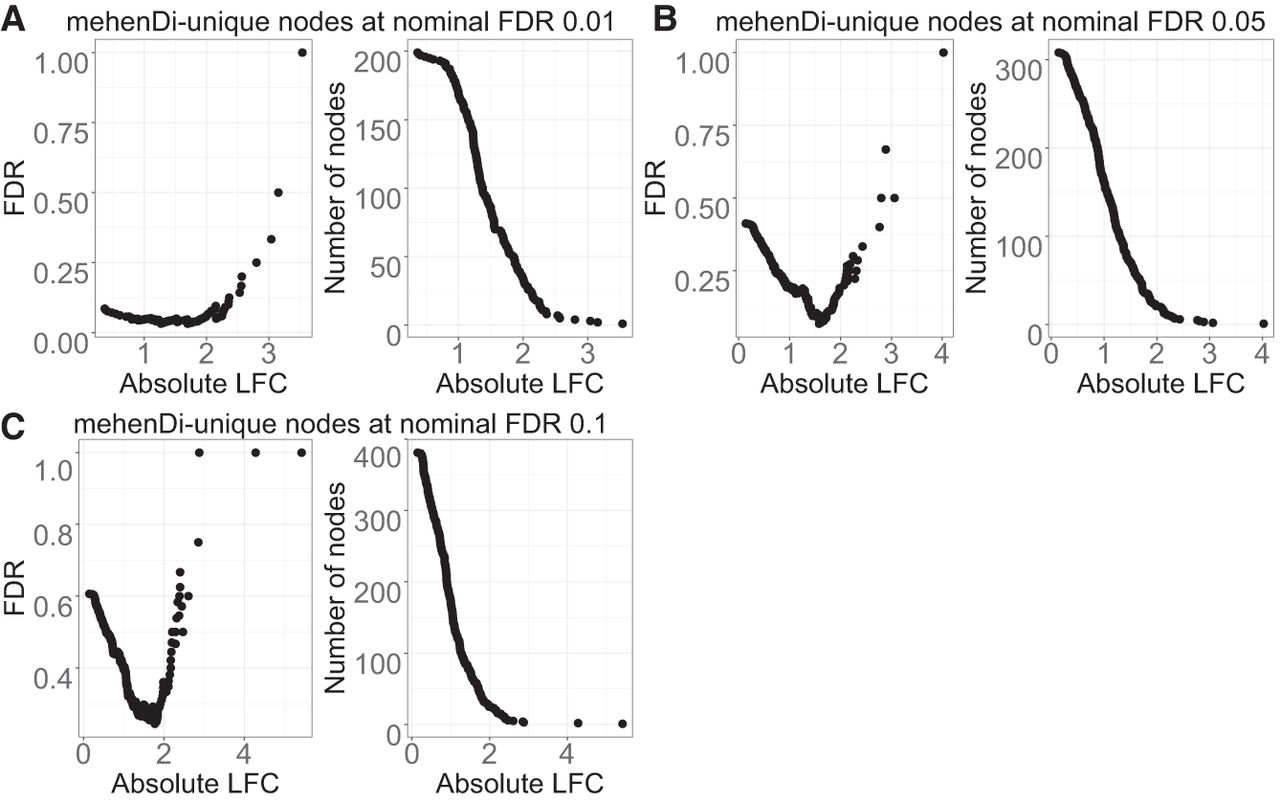
Figure 4.
Examination of error metrics for the unique nodes obtained for mehenDi when doing comparison with treeclimbR on the BrSimNorm data set. We vary the magnitude of log fold change (LFC) and plot the empirical FDR and the total number of nodes that are left after filtering the unique nodes based on LFC for the different nominal FDR thresholds. (A–C) Metrics obtained on nominal FDR 0.01, 0.05, and 0.10.


