
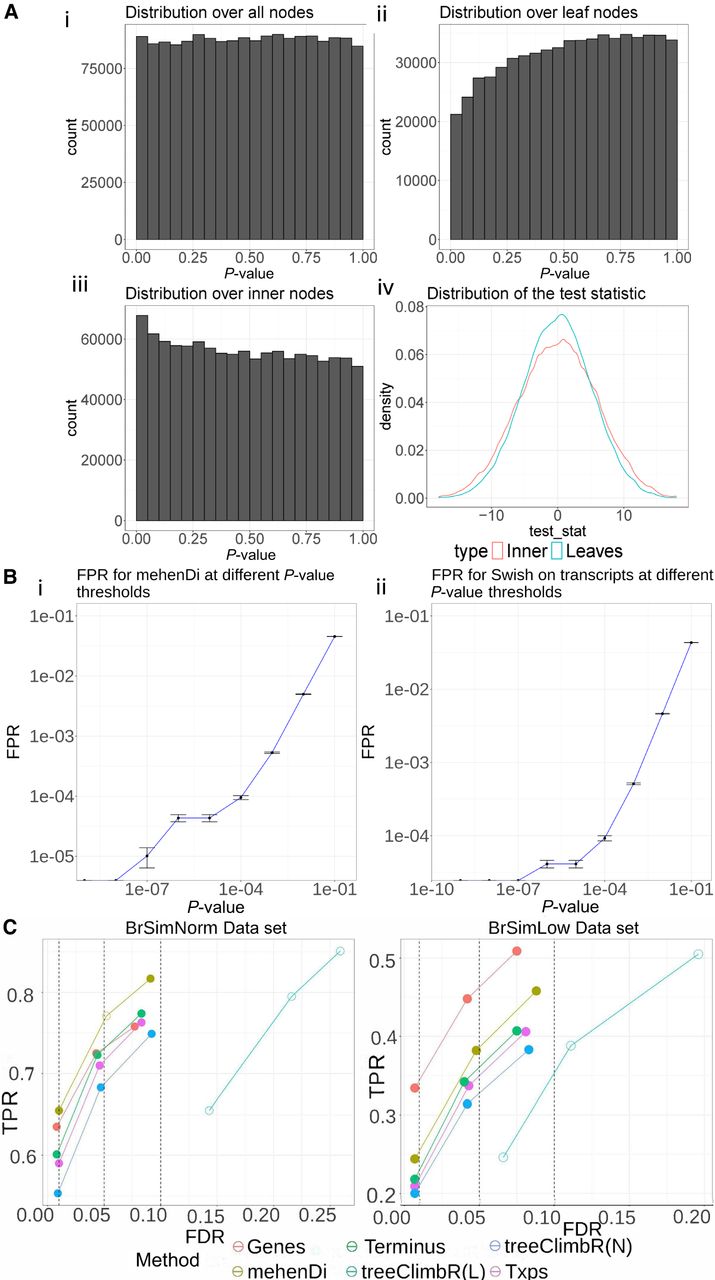
Evaluation on the simulated data sets. (A) Distribution of P-values and test-statistic for Swish for the null brain simulation. (i) Distribution of the P-values on the entire node set over the tree when all hypotheses are tested together using Swish. (ii) Distribution of the P-values over the leaf nodes. (iii) Distribution of the P-values over the inner nodes. (iv) Distribution of the test-statistic on the inner and leaf nodes, which is used by Swish to generate the P-values. (B) The mean false positive rate (FPR) obtained across the 10 null simulations by varying the P-value threshold. The vertical error bar represents the variation around the mean. (C) True positive rates and empirical false discovery rates at the different nominal FDR thresholds across the different methods and entities for the BrSimNorm and BrSimLow data sets. Both metrics have been rounded to three decimal places.


