
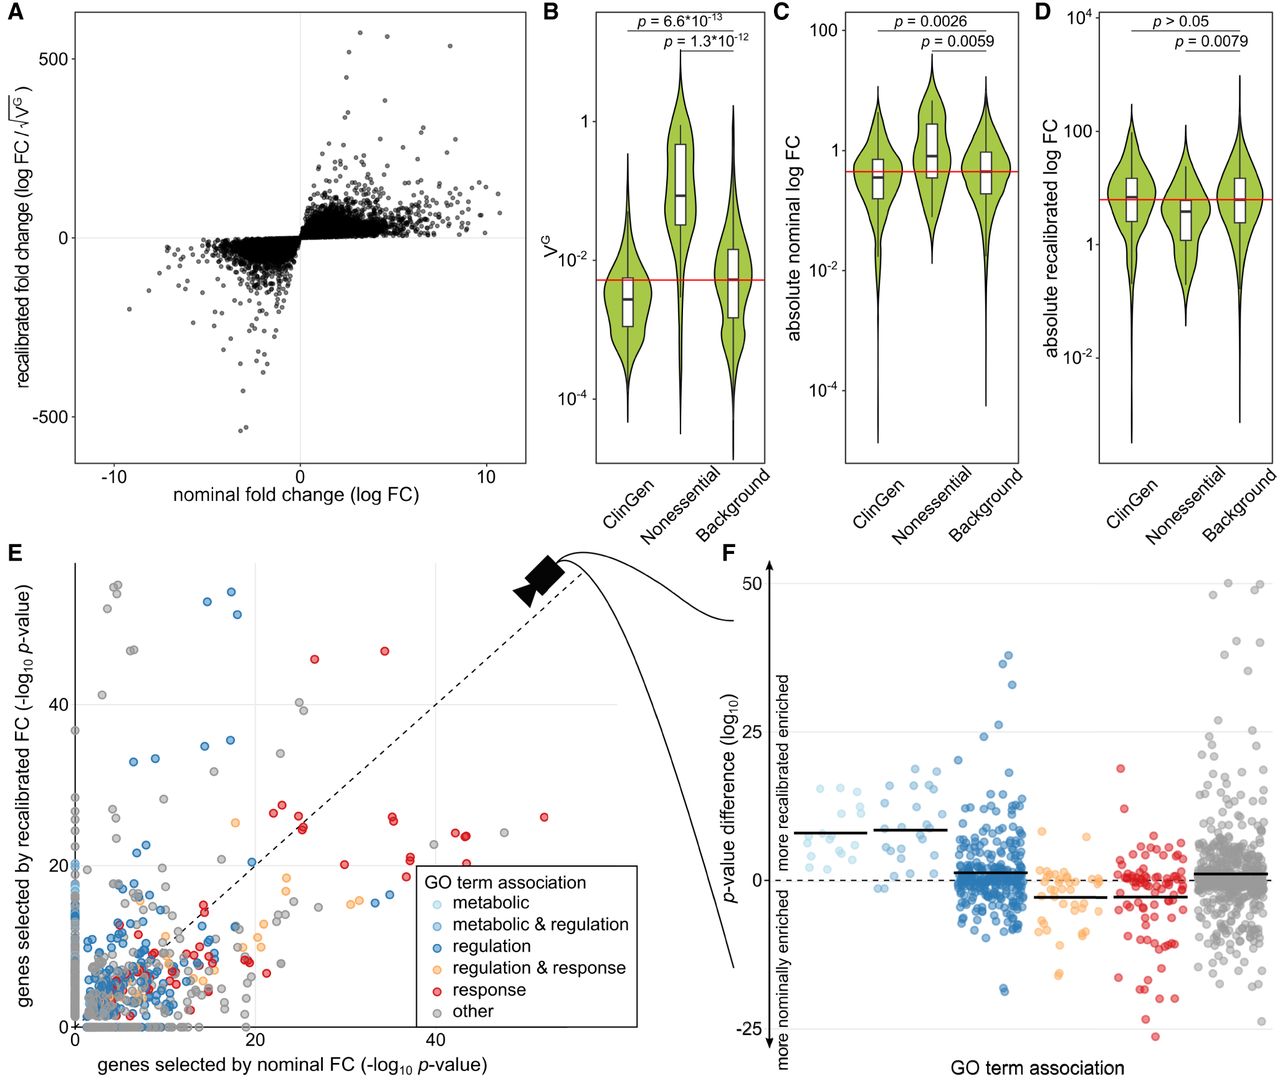
Fold change recalibration of a DE experiment of IFNG treatment. (A) Nominal compared to recalibrated fold changes of individual genes from Alasoo et al. (2018). (B–D) Impact of recalibration on genes from three different gene sets: ClinGen, Nonessential, and all other genes (Background). Part B displays the distribution of VGH per set; part C, the absolute log fold changes before recalibration (nominal); and part D, the recalibrated absolute log fold changes. Each violin represents the total distribution of values, with boxes in the violin indicating 25% and 75% quantiles and the median illustrated as a black line. Whiskers are 1.5 times the interquartile range. The red line denotes the median over all genes. Significance labels are the result of a two-sided comparison with Mann–Whitney U test of the two groups. (E) Effect on GO term enrichment: adjusted P-values of GO term enrichment from 2000 genes selected by nominal compared to recalibrated FC. GO-terms are colored based on string matching (association). The dashed center line marks the same enrichment in both sets. GO terms above the line are more enriched after the recalibration, and terms below the line are more enriched before. (F) Different view on the change in GO term enrichment P-values grouped by associations. Colored dots are GO terms; the colored vertical lines are the log-mean per association. Terms containing the words “regulation” (blue) and “metabolic” (light blue) are, on average, more enriched after recalibration, whereas terms containing the word “response” (red) are, on average, more enriched before recalibration.


