
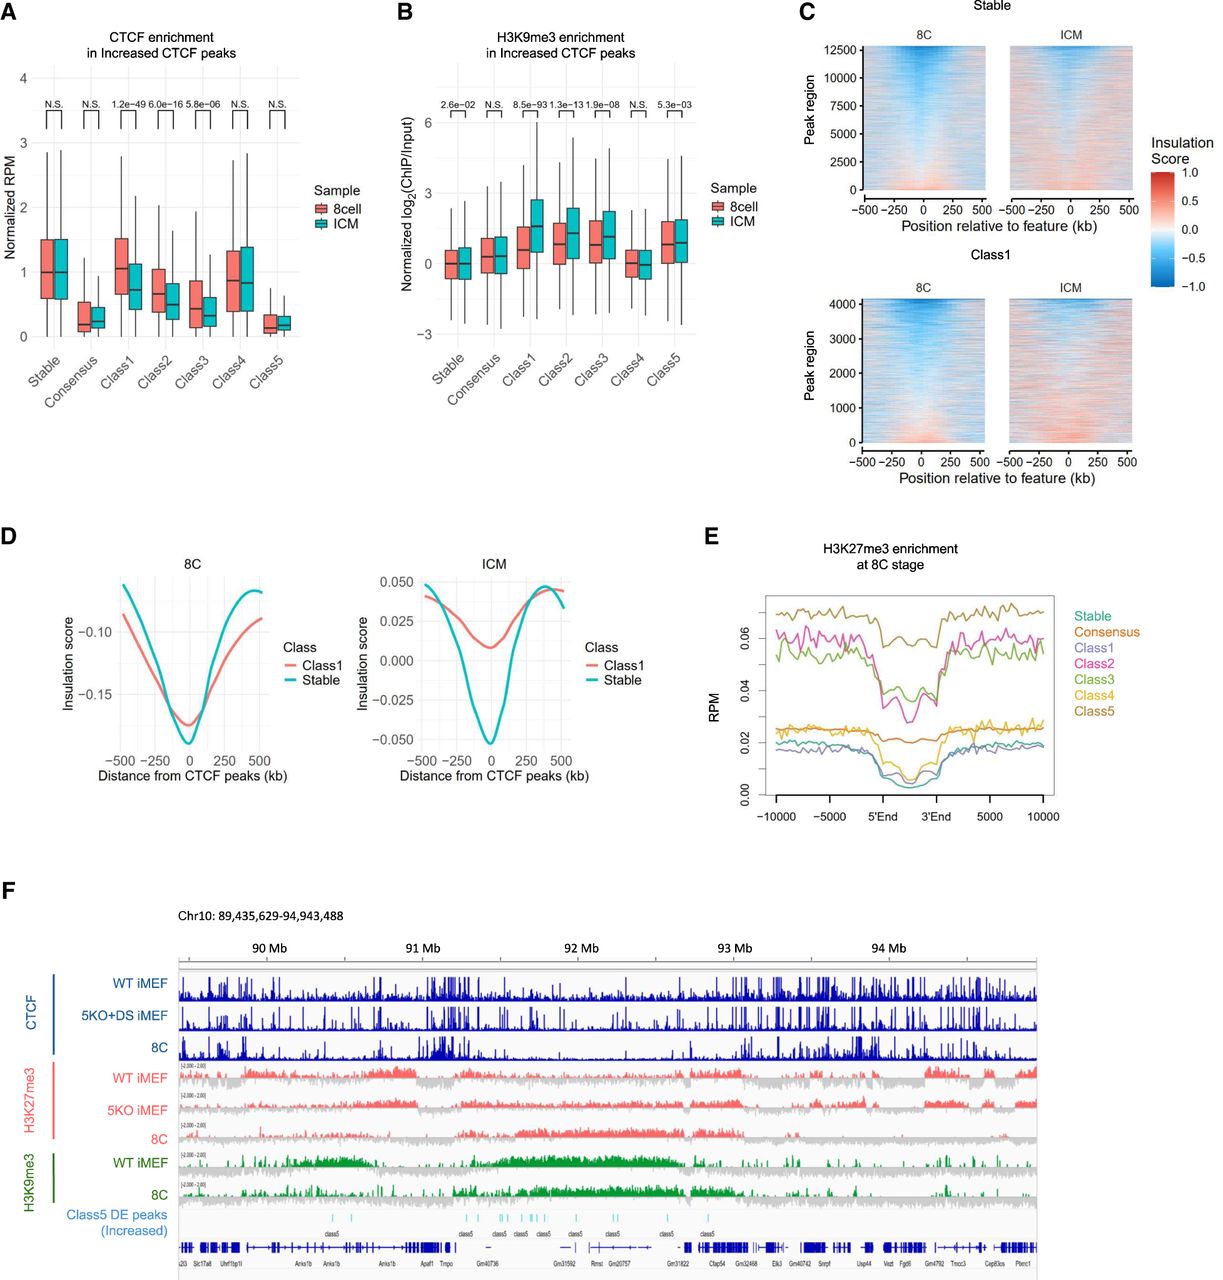
Association of DE peaks with 3D genome structures in mouse early embryos. (A) CTCF accumulation in “Increased” DE peaks in early mouse embryos. The y-axis represents CTCF accumulation, corrected by the median value of Stable CTCF peaks in each developmental stage. CTCF accumulation in DE peaks is tested between the eight-cell stage and ICM using a t-test. (B) H3K9me3 accumulation in “Increased” DE peaks in early mouse embryos. The y-axis represents H3K9me3 accumulation (log2[ChIP/Input]), corrected by the median value of Stable CTCF peaks in each developmental stage. H3K9me3 accumulation in DE peaks is tested between the eight-cell stage and ICM using a t-test. (C,D) A tornado plot showing the insulation status in Stable and “Increased” Class1 DE peaks in eight cells and ICM. Panel C displays the results for each region in a heat map, and panel D shows the average values of regions. The x-axis represents the distance from CTCF peaks. (E) Enrichment of H3K27me3 in the eight-cell stage around “Increased” DE peaks. Class 5 is embedded in regions with high H3K27me3 enrichment. (F) Representative regions of “Increased” Class5 DE peaks embedded in H3K27me3 enriched regions in the eight-cell stage.


