
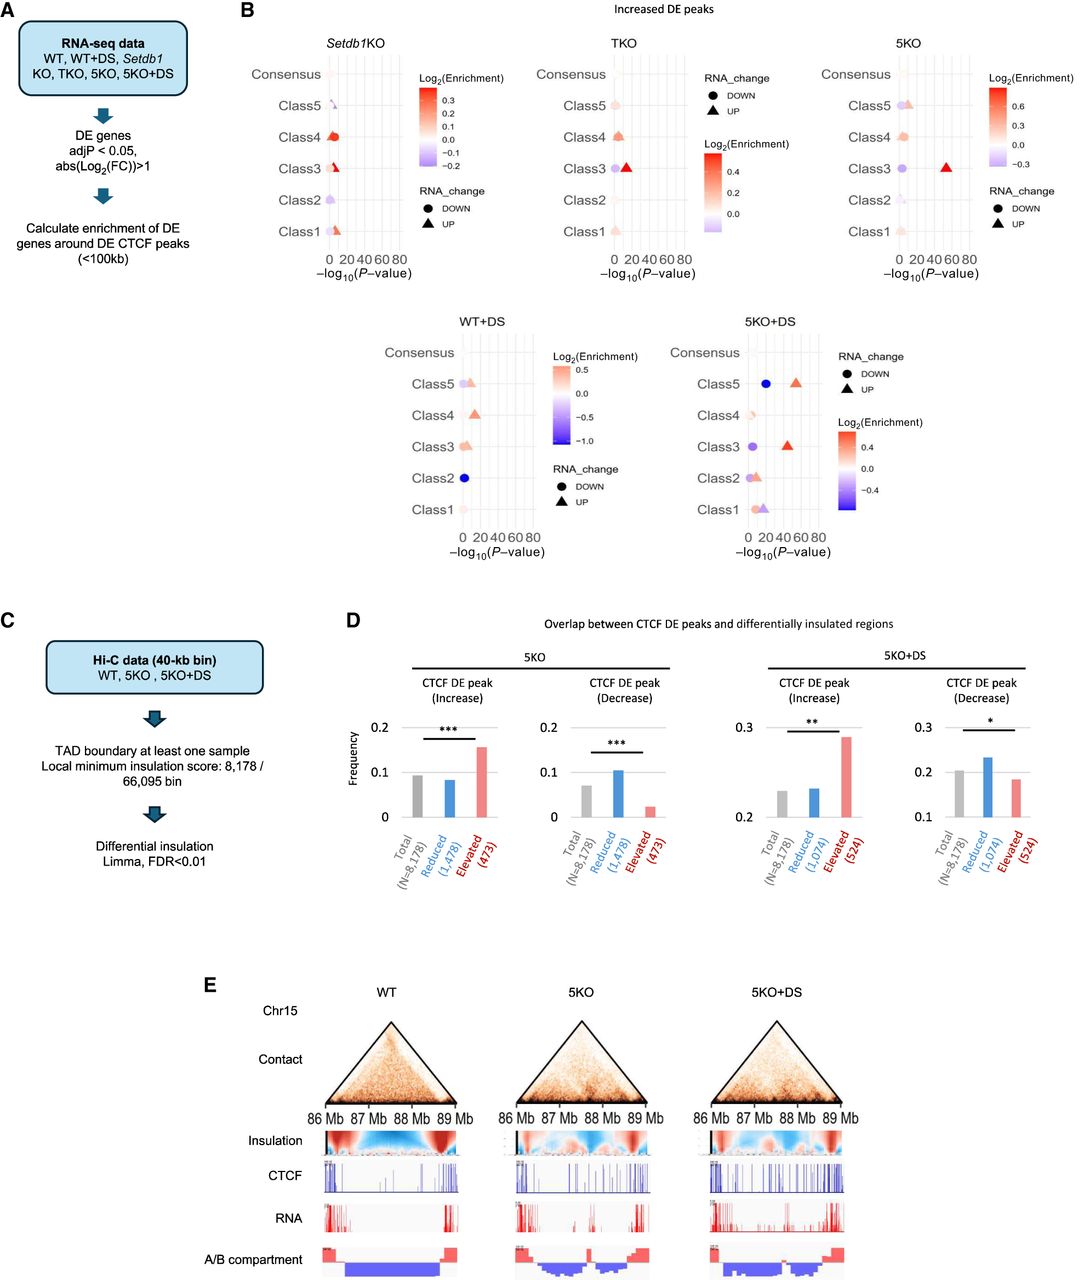
Association of DE peaks with changes in gene expression and 3D genome structure. (A) A process for analyzing the association between DE peaks and changes in gene expression. (B) A dot plot showing the enrichment of differentially expressed genes around DE peaks. The x-axis represents −log10(adj. P-value). The enrichment results for upregulated and downregulated genes are represented by circles and triangles, respectively. The degree of enrichment (log2[fold change]) is color-coded, with red indicating enrichment and blue indicating depletion triangles and circles, respectively. The degree of enrichment (log2[Enrichment]) is color-coded, with red indicating enrichment and blue indicating depletion. The details of the statistical calculations are described in the “Statistical analysis” section of the Methods. All raw data used in B are described in Supplemental Table S3. (C) A process for analyzing the association between DE peaks and changes in insulation. (D) Frequency of overlap between CTCF DE peaks and differentially insulated regions. (E) Representative regions of differential insulation overlapping with “Increased” DE peaks. The figure displays, from top to bottom, the contact heat map, insulation map, CTCF ChIP-seq signal, RNA-seq signal, and compartment information. In this region, an increase in CTCF binding, the emergence of new insulation sites, an increase in gene expression, and a B-to-A compartment change are observed in both 5KO and 5KO+DS iMEFs.


