
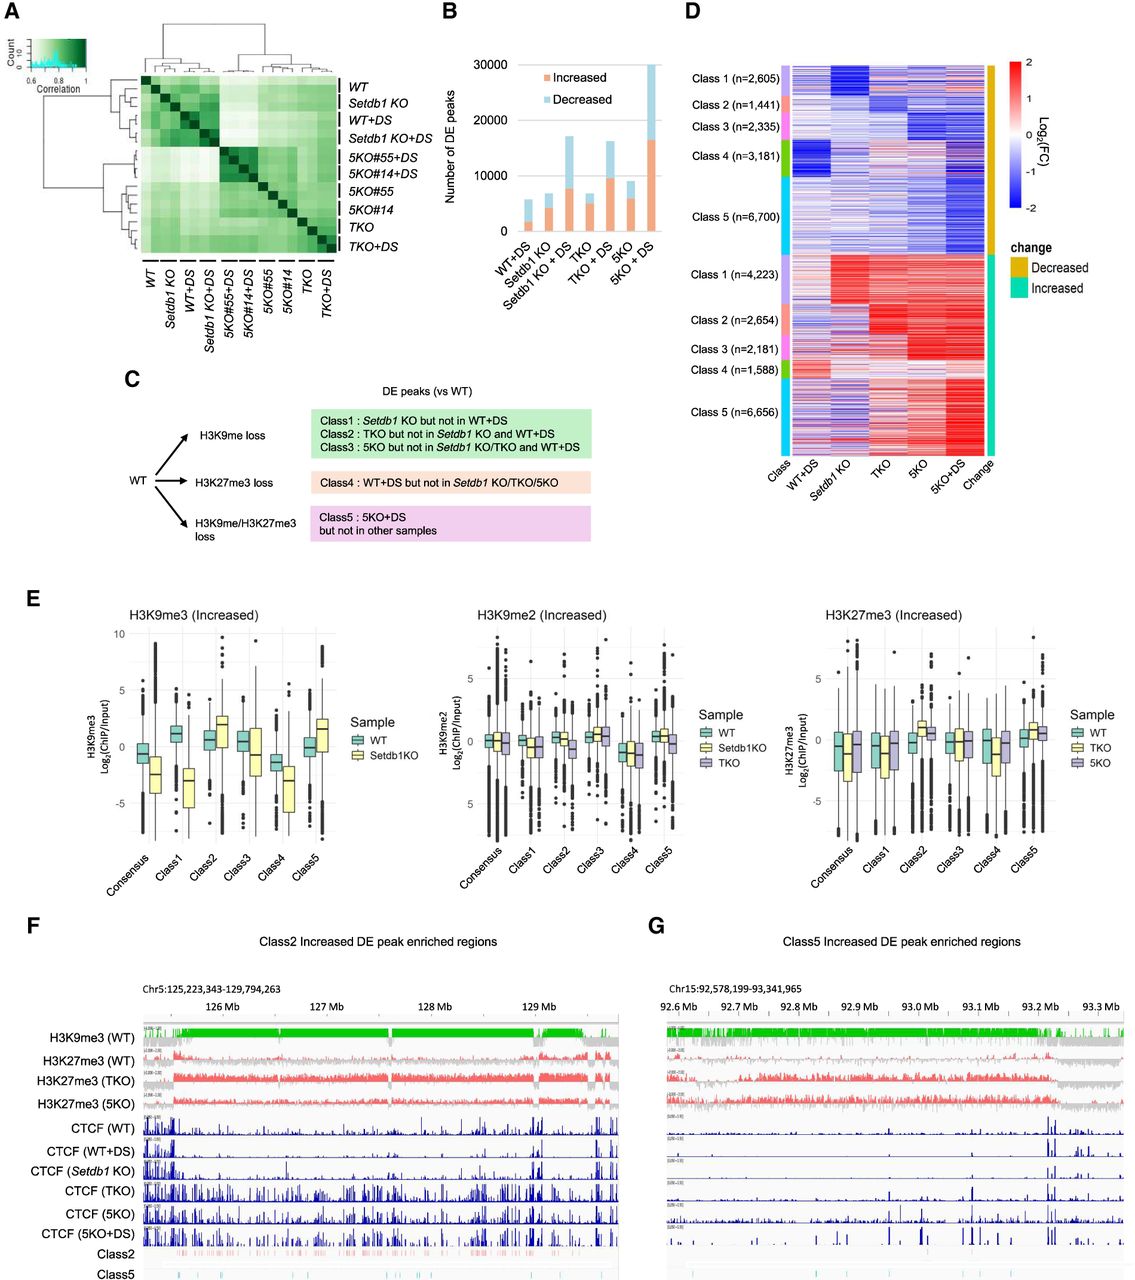
Dysregulation of CTCF binding profiles by H3K9/K27 methylation deficiency. (A) Clustering analysis of CTCF ChIP-seq data. Each sample analyzed in two biological replicates, showing a high correlation between replicates. (B) The number of differentially enriched (DE) peaks. A bar graph represents the number of CTCF accumulation increased or decreased in each sample. (C) The classification method for DE peaks. (D) Heat map of CTCF enrichment among DE classes. (E) Epigenomic profiles at increased DE peaks. H3K9me3 enrichment in WT and Setdb1 KO iMEFs (left), H3K9me2 enrichment in WT, Setdb1 KO, and TKO iMEFs (middle), and H3K27me3 enrichment in WT, TKO, and 5KO iMEFs (right). Statistical tests were performed using t-tests, and multiple testing correction was applied using the Benjamini–Hochberg (BH) method. All statistical results are provided in Supplemental Table S1. (F) Representative Class 2 increased DE peaks enriched regions. (G) Representative Class 5 increased DE peaks enriched regions.


