
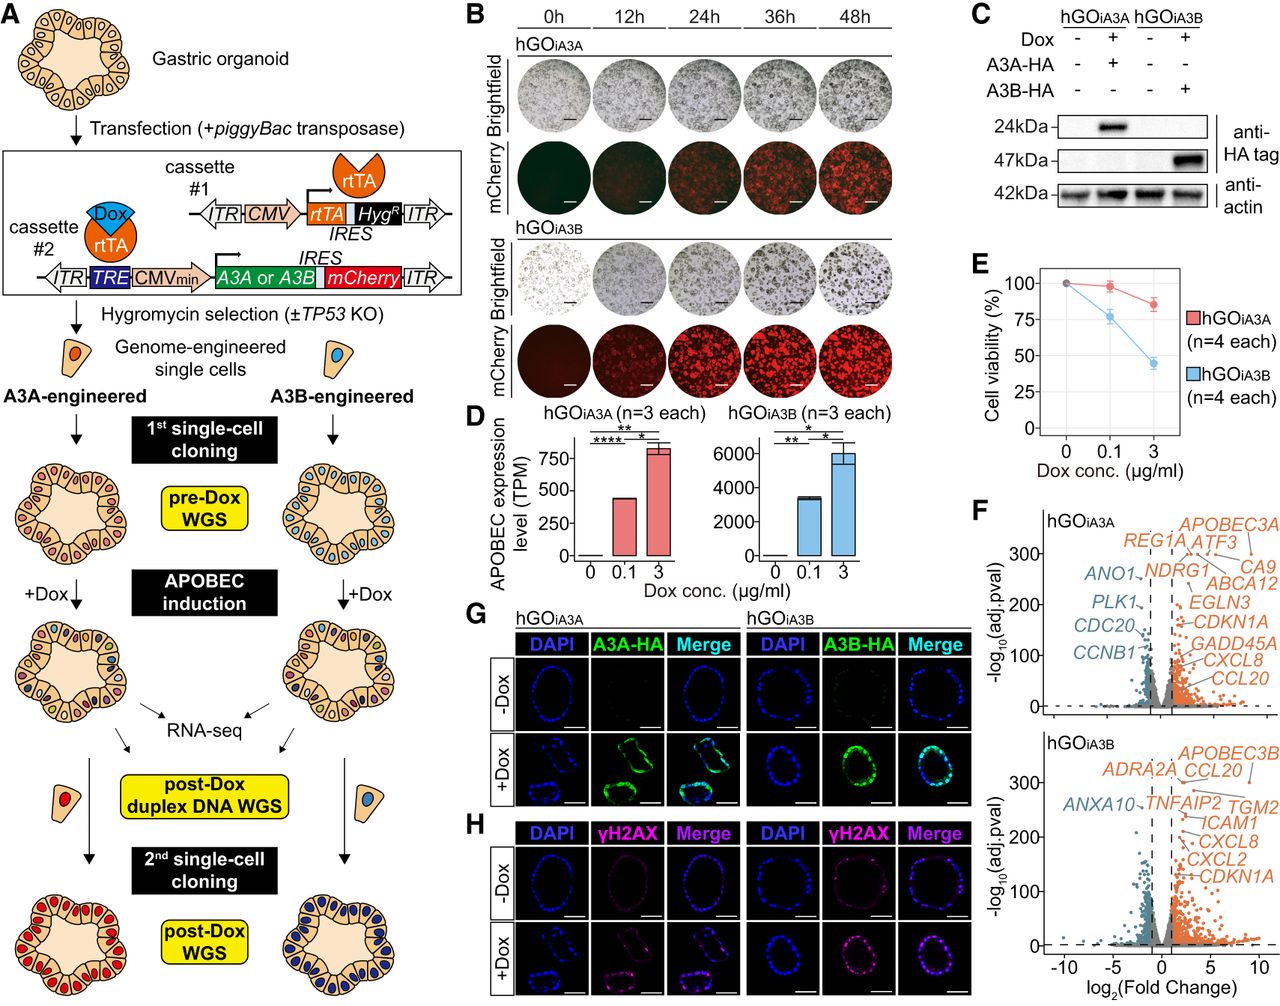
Overview of conditional APOBEC (APOBEC3A or APOBEC3B) overexpression models with human gastric organoids. (A) Experimental design of the study. Schematic illustration of genetic engineering, cloning, and sequencing (whole-genome sequencing, duplex sequencing, and bulk RNA-seq) is shown. Dox, doxycycline. (B) Changes of morphology and mCherry fluorescence during 48 h with 0.1 µg/mL doxycycline treatment; (top) hGOiA3A lines, and (bottom) hGOiA3B lines. Scale bars represent 1 mm. (C) Inducible expression of APOBEC3A (A3A) or APOBEC3B (A3B) enzymes in hGOiA3A and hGOiA3B lines, respectively, following 3 µg/mL doxycycline treatment for 48 h. (D) Expression levels of APOBEC3A (A3A) or APOBEC3B (A3B) in each line following 0.1 µg/mL and 3 µg/mL doxycycline treatment for 48 h; (left) hGOiA3A lines (n = 3 per condition), and (right) hGOiA3B lines (n = 3 per condition). Data are presented as mean ± 95% confidence interval. Statistical significance was determined using a t-test: (*) P < 0.05, (**) P < 0.005, (****) P < 0.00005. (E) Changes of viability of each line following 0.1 µg/mL and 3 µg/mL doxycycline treatment for 48 h (n = 4 per each condition). Data are presented as mean ± 95% confidence interval. (F) Differentially expressed genes upon APOBEC (A3A or A3B) overexpression following 0.1 µg/mL doxycycline treatment for 48 h; (top) hGOiA3A line, and (bottom) hGOiA3B line. adj.pval, adjusted P-value. (G) Subcellular localization of overexpressed A3A and A3B following 3 µg/mL doxycycline treatment for 48 h in each line; (left) hGOiA3A line, and (right) hGOiA3B line. Scale bars represent 50 µm. (H) γ-H2AX foci following 3 µg/mL doxycycline treatment for 48 h in each line; (left) hGOiA3A line, and (right) hGOiA3B line. Scale bars represent 50 µm.


