
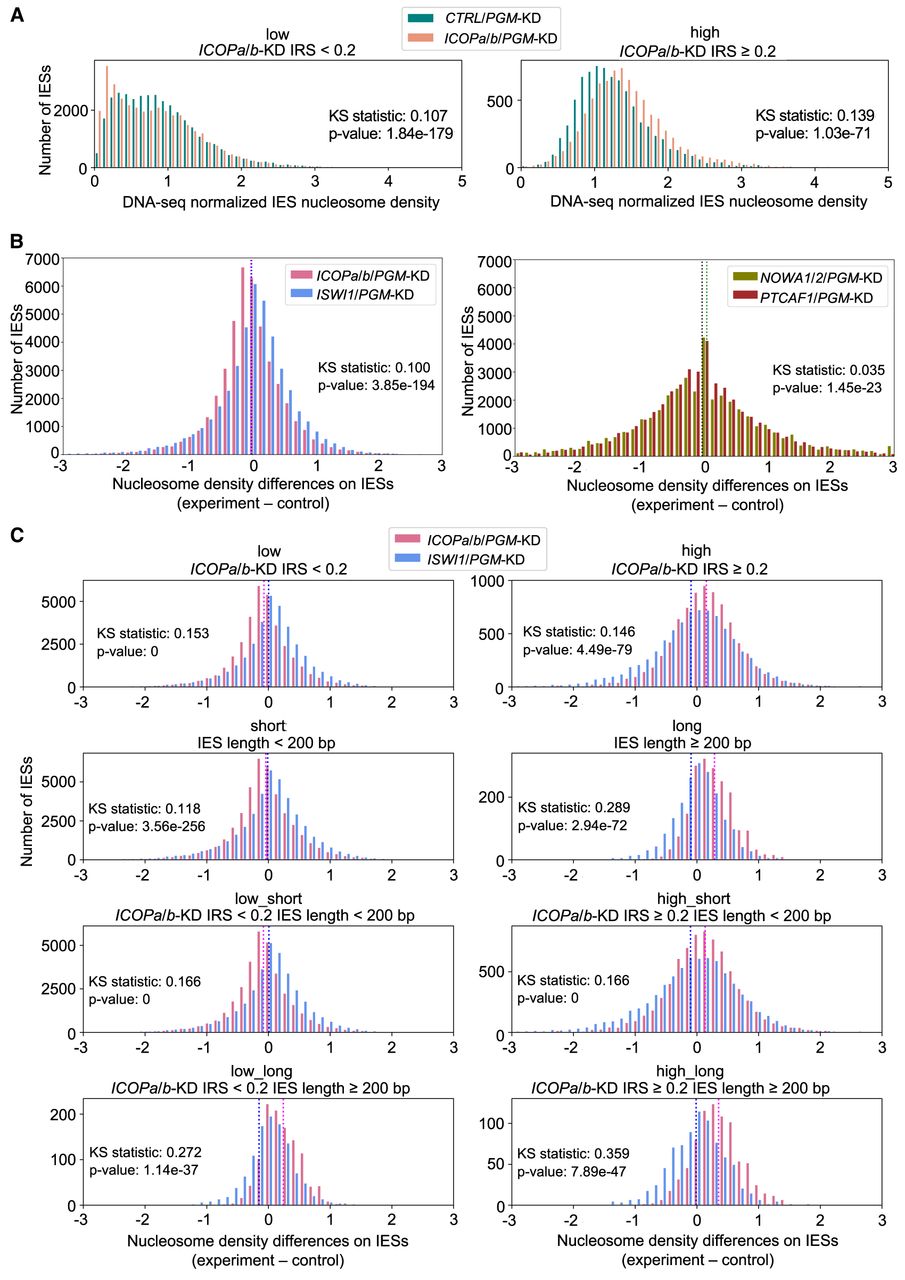
Nucleosome density changes associate with ICOP KDs. (A) Normalized nucleosome densities across IESs for ICOPa/b/PGM-KD and CTRL/PGM-KD. IESs are grouped as low (IRS < 0.2) or high (IRS ≥ 0.2) IRS in ICOPa/b-KD. (B) Nucleosome density differences for all IESs. Means are dashed lines. Magenta indicates ICOPa/b/PGM-KD; blue, ISWI1/PGM-KD; green, NOWA1/2/PGM-KD; and black, PTCAF1/PGM-KD. (C) Comparison of ICOPa/b/PGM-KD and ISWI1/PGM-KD in selected IES groups: IESs were grouped by IRS in ICOPa/b-KD (low: IRS < 0.2; high: IRS ≥ 0.2) and IES length (short: IES length < 200 bp; long: IES length ≥ 200 bp). IES group is given above the diagrams. Means are dashed lines. Magenta indicates ICOPa/b/PGM-KD; blue, ISWI1/PGM-KD.


