
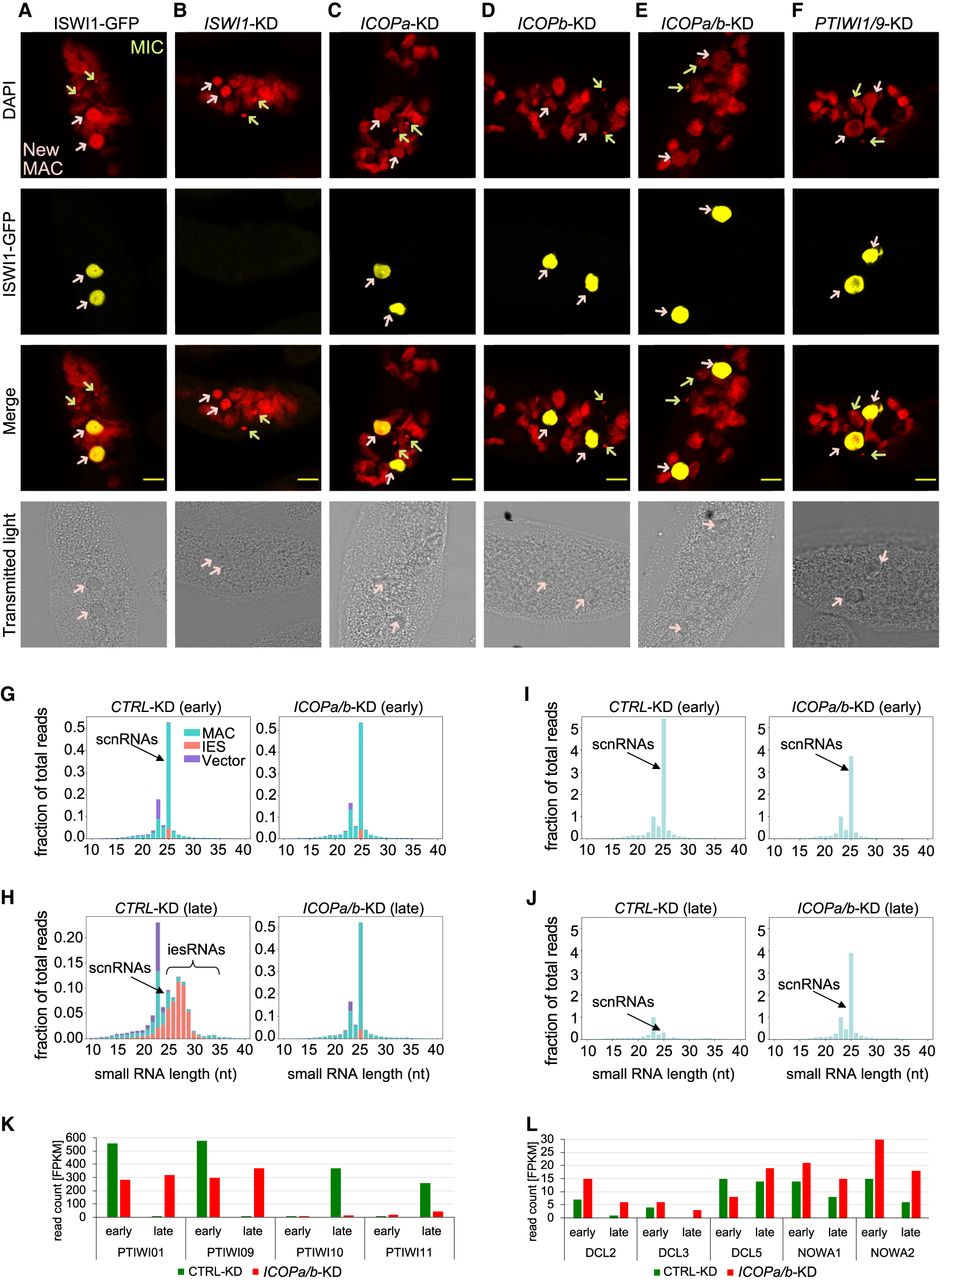
Effects of ICOPa and ICOPb KDs on ISWI-GFP localization, sRNAs, and gene expression. (A–F) Confocal fluorescence microscopy of ISWI1-GFP localization in different gene KD backgrounds. (A) Positive control is the ISWI1-GFP-transformed cells without RNAi. Red indicates DAPI; yellow, GFP; green arrow, MIC; and pink arrow, new MAC. Scale bar = 10 µm. (G–J) sRNA histograms. (G,H) sRNA reads mapped to the L4440 plasmid sequence (vector), MAC, and IESs. (I,J) Histogram of MAC genome–matching sRNAs normalized against MAC genome–matching siRNAs. Early indicates 40% of cells have fragmented MAC (T6–T10); late, most cells with visible new MAC (T12–T16). (K,L) Histogram of mRNA expression levels in FPKM for different development-specific genes.


