
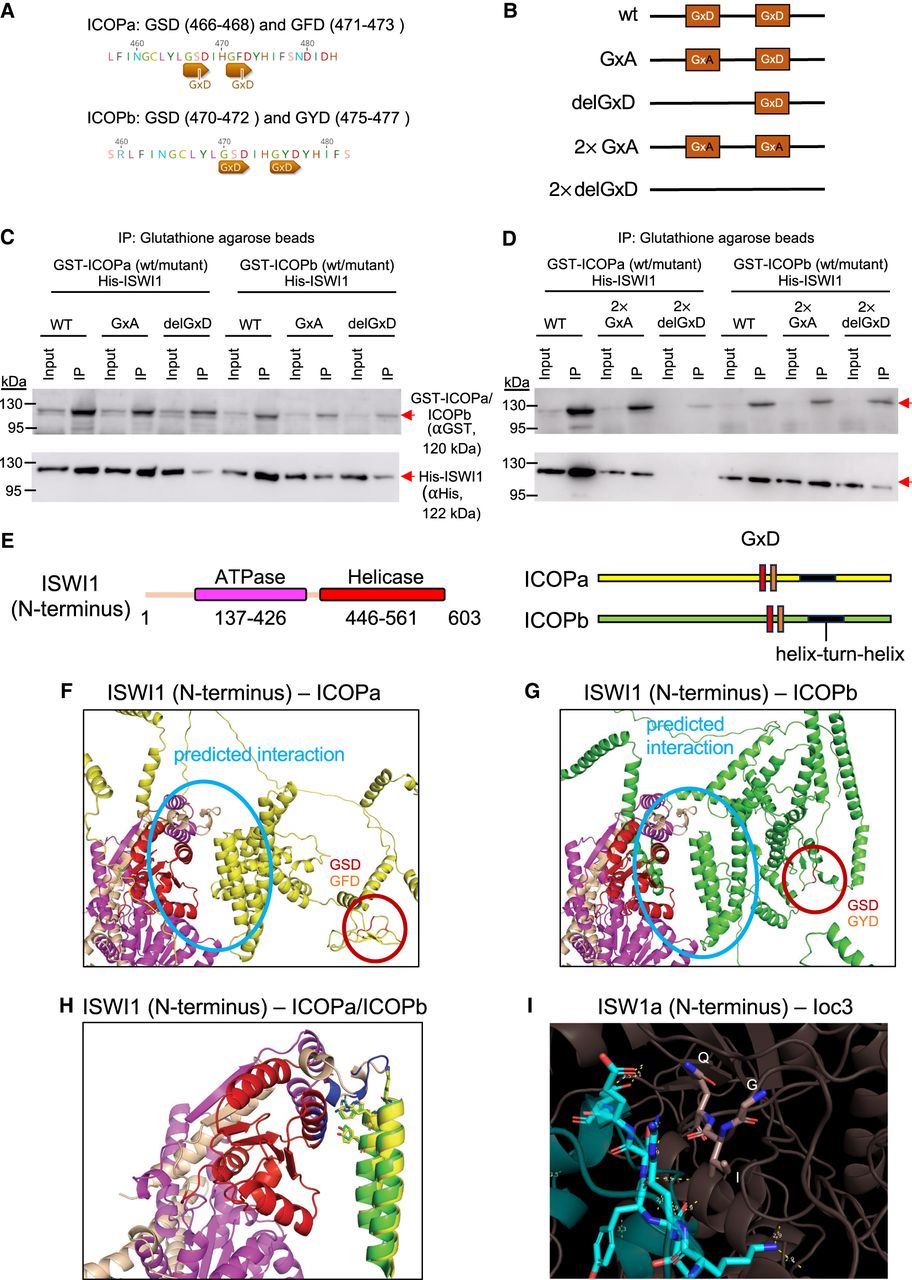
Investigation of the GxD signature in ICOP/ISWI1 interaction. (A) Screenshots from Geneious Prime (version 2023.1.1) showing the GxD signature in ICOPa and ICOPb. (B) Schematic representation of GxD mutants generated. (C,D) Western blot of co-IP of GST-ICOP GxD mutants and His-ISWI1 overexpressed in E. coli probed with anti-GST and anti-His antibodies. GST-ICOP wild-type is a control. (E) Schematic representation of the sequences used for complex predictions in F and G. (F–H) Structure prediction of multimers (ISWI1 N terminus [residues 1–603] with ICOPa or ICOPb) with AlphaFold (version 2.2.0). Yellow indicates ICOPa; green, ICOPb; red, GSD signature; orange, GFD/GYD signature; wheat, ISWI1; magenta, ISWI1 ATPase domain; and red, ISWI1 helicase domain. (F,G) ISWI1–ICOPa and ISWI1–ICOPb interaction, respectively. Predicted interaction interface and GxD signatures are circled. (H) ISWI1 N terminus with interacting helices of ICOP paralogs (ICOPa: residues 556–597; ICOPb: residues 560–603). Blue indicates proximate residues on ISWI1. Proximate residues of ICOPs are shown as sticks. (I) GxD signature in the published crystal structure (PDB accession number 2Y9Y). ISW1a (del_ATPase; cyan) and Ioc3 (WHIM containing protein; dark salmon) from yeast. GxD signature (GIQ in Ioc3) and spatially close residues in ISW1a are shown as sticks. Yellow indicates polar contacts between the proteins.


