
Figure 4.
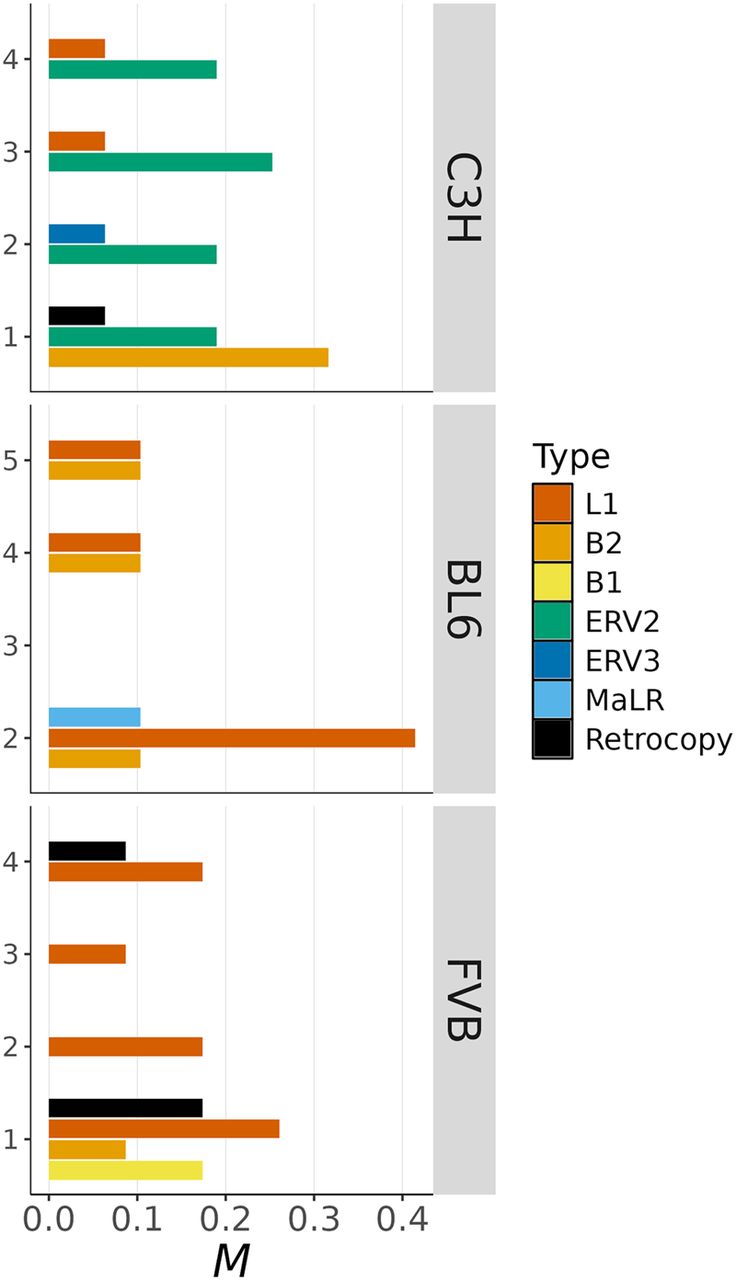
Mobile insertions. The rate of insertions per haploid genome per generation (M) is shown by MA sample (on the y-axis) and type of mobile element (in colors).
(Downloading may take up to 30 seconds. If the slide opens in your browser, select File -> Save As to save it.)
Click on image to view larger version.
Mobile insertions. The rate of insertions per haploid genome per generation (M) is shown by MA sample (on the y-axis) and type of mobile element (in colors).
 CiteULike
 Delicious
 Digg
Digg Facebook
 Google+
 Reddit
 Twitter
