
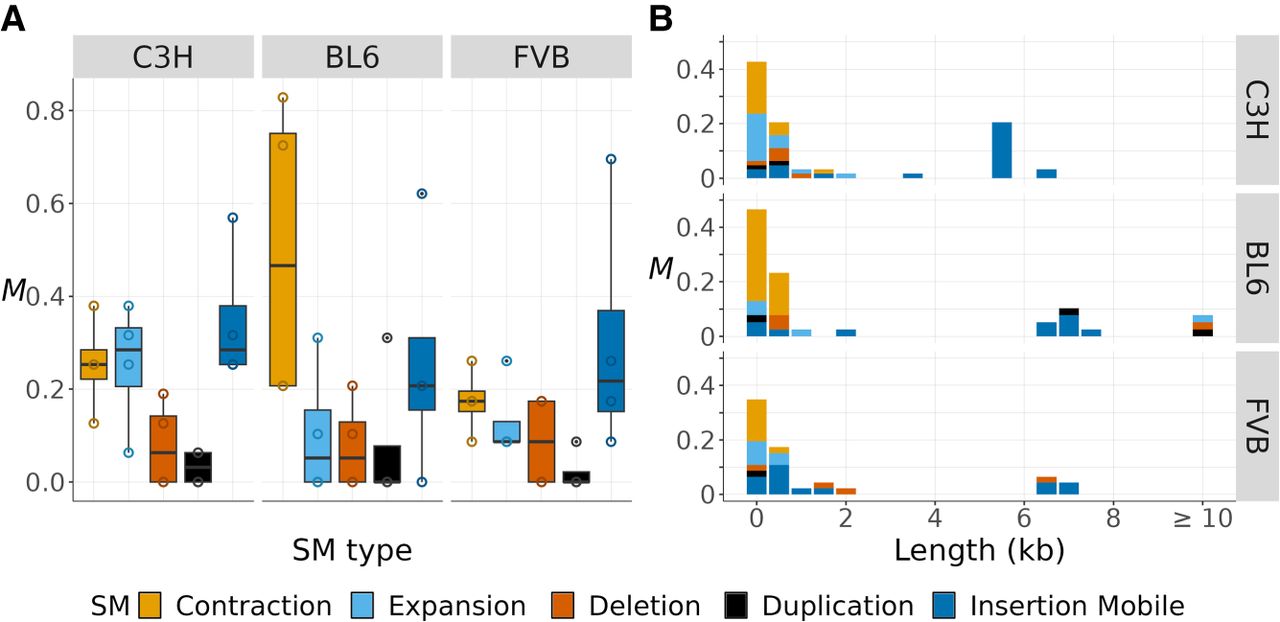
Figure 3.
Rates and spectra of SMs for three mouse strains. (A) The SM rate per haploid genome per generation (M) is plotted as open points and boxplots for different types of SMs (in colors). Data points represent individual MA samples. (B) The spectrum of new SMs by rate (M) and length (in kilobases, rounded to the nearest 0.5 kb).


