
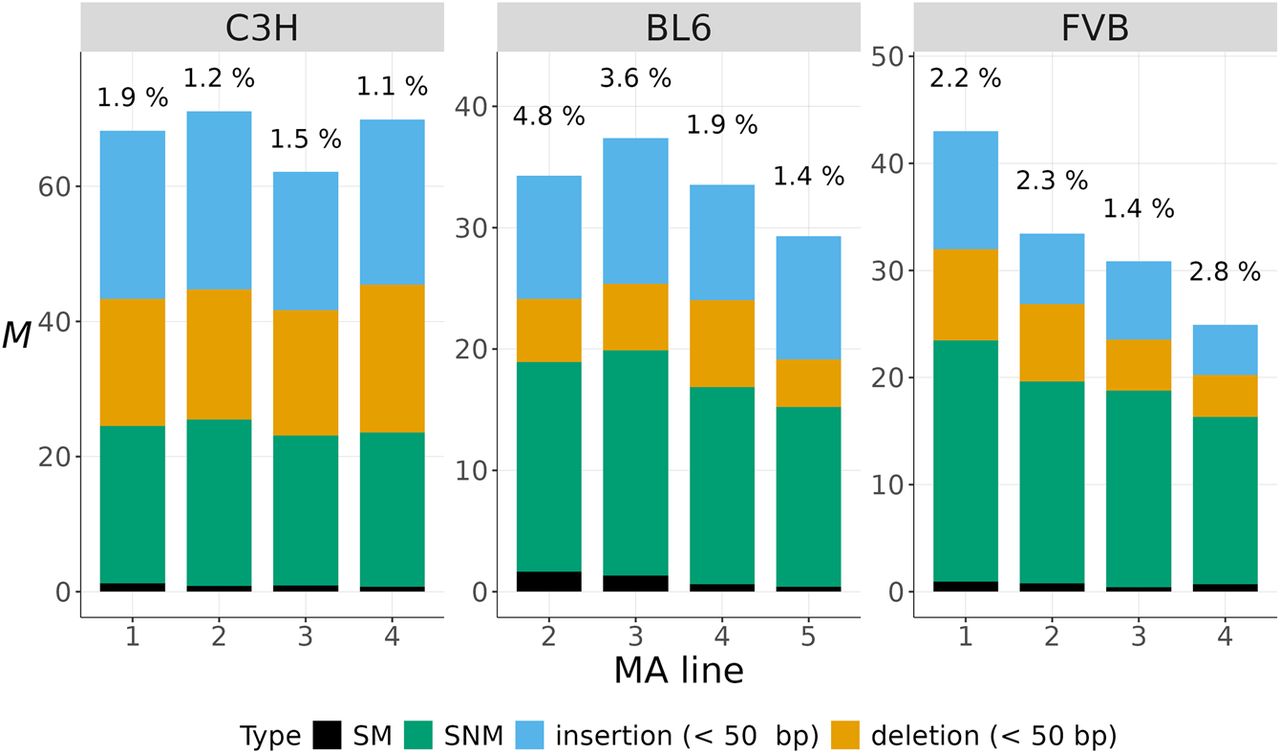
Figure 1.
The complete spectrum of new mutations. The mutation rate per haploid genome per generation (M) for different types of mutations (in colors) is shown for four MA samples from each strain. The percentages at the top of each bar indicate the proportion of SMs.


