
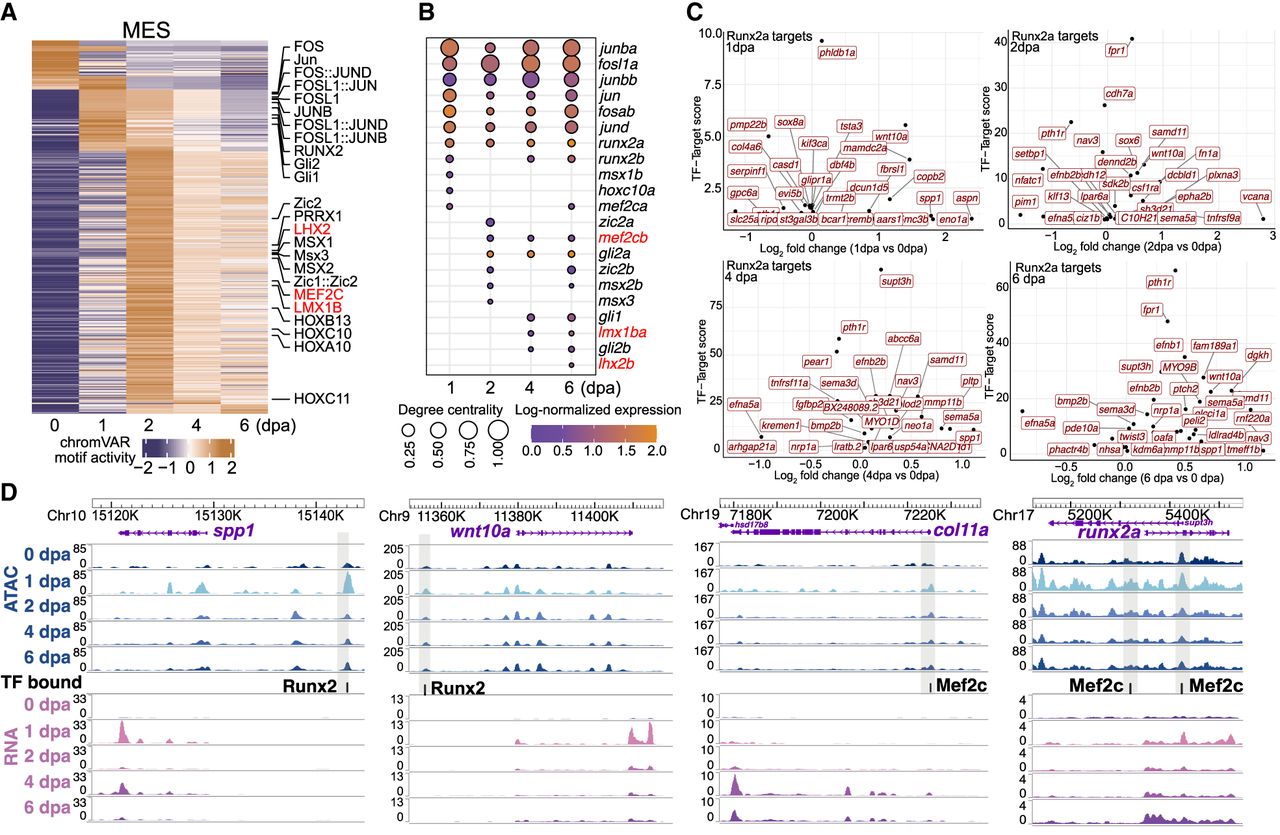
Gene regulatory network construction in the MES cells. (A) A heatmap displays differential activity of motifs over time in pseudobulk MES cells, with particular motifs of interest marked on the side. Motifs critical for bone development are indicated in red. (B) A dot plot illustrates the expression of TF genes and their degree centrality over time, corresponding to the motifs presented in A. TF genes critical for bone development are indicated in red. (C) A scatter plot shows the top targets of Runx2a at the regenerating stages. Targets were ranked by grnboost2 TF–target importance scores. The y-axis represents grnboost2 score; the x-axis shows log2 fold change of target gene expression compared with 0 dpa. (D) Example views from the WashU Epigenome Browser of Runx2 and Mef2c footprints located in regions that become more accessible during regeneration, along with their nearby targeted genes. Blue tracks are aggregated and normalized snATAC-seq signals across time points; pink tracks are aggregated and normalized snRNA-seq signals across time points. The TF bound track shows predicted TF binding footprints. Shaded areas highlight DARs that gained accessibility during regeneration.


