
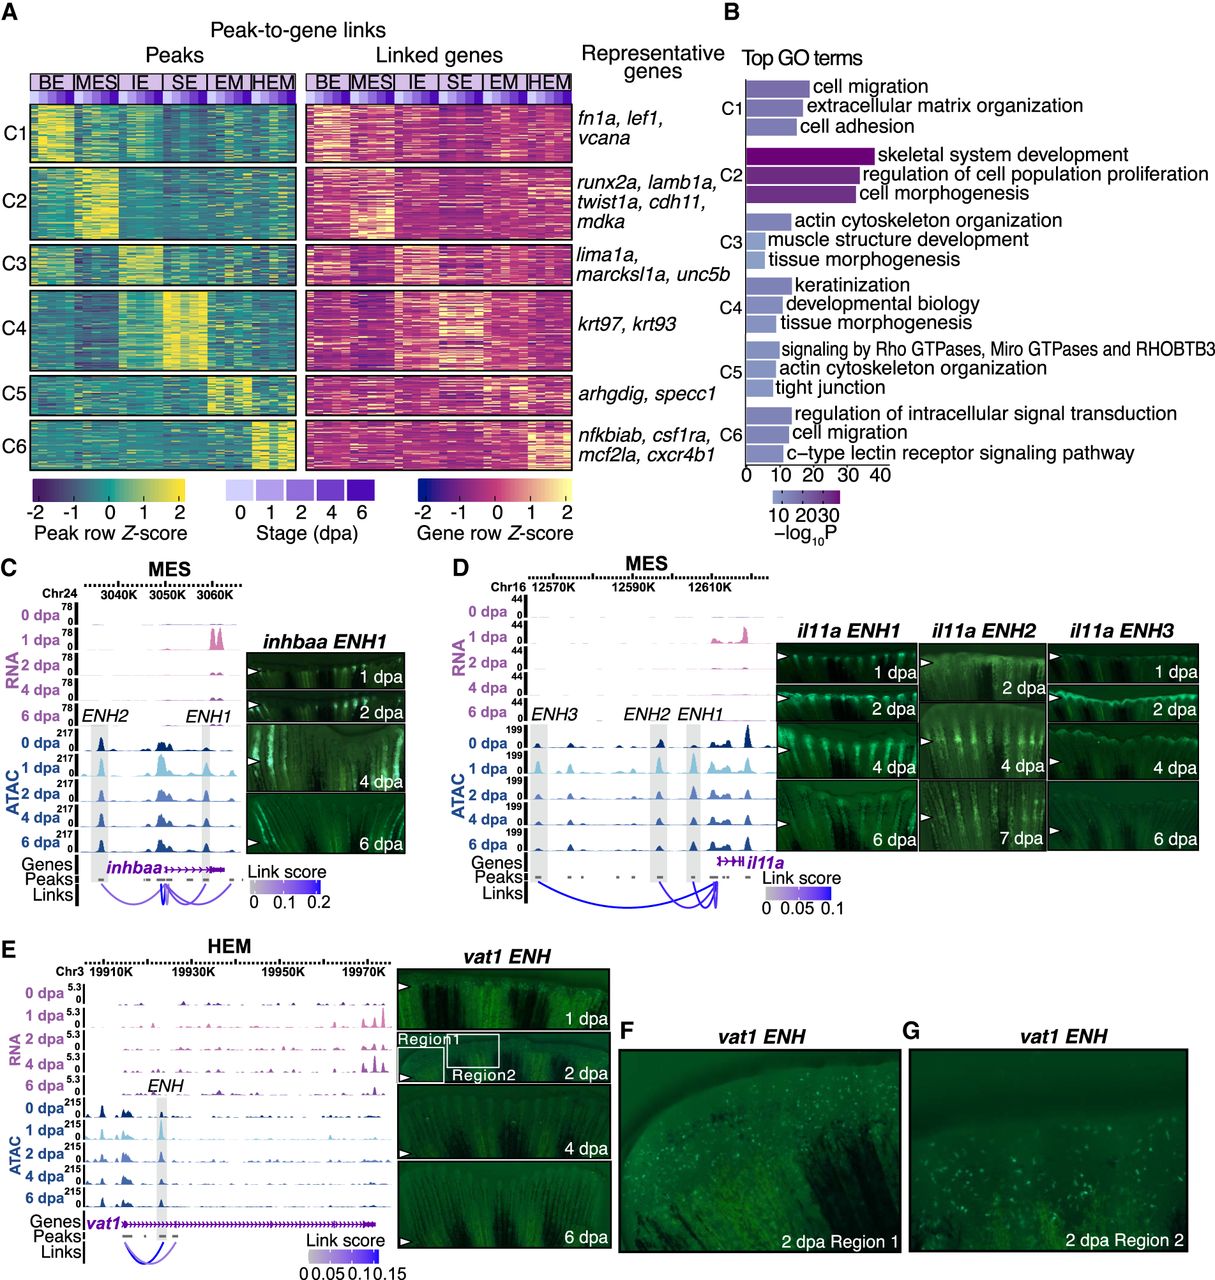
Characterization of common and cell-type-specific cis-regulatory elements in regeneration. (A) Heatmaps display chromatin accessibility (left) and gene expression (right) for peak-to-gene links, with peaks clustered using k-means clustering (k = 6, C1 through C6 represent the six clusters) across cell types and stages. For each cluster, selected highly regulated genes (with more than five linked peaks) relevant to the GO terms in B are displayed next to the gene expression heatmap. (B) Representation of enriched top GO terms associated with the highly regulated genes linked to each peak cluster in A. (C,D) On the left, WashU Epigenome Browser views show aggregated and normalized snRNA-seq signals (pink tracks) and snATAC-seq signals (blue tracks) across time points surrounding genes inhbaa and il11a in MES cells, respectively. Regions of candidate RREs are shaded in gray. Below these signal tracks, the loops illustrate peak-to-gene linkages identified in MES cells. On the right, in vivo enhancer reporter assay results for these enhancer regions are shown across various regenerating stages from F0 zebrafish. The white arrows indicate amputation site. (E) Similar to C and D but presenting a WashU Epigenome Browser view around the gene vat1 in the HEM cells. Candidate RRE is highlighted in gray shades. On the right, in vivo enhancer reporter assay results for this enhancer region are shown across various regenerating stages from F0 zebrafish. The white arrows indicate amputation site. (F,G) Two zoomed-in views from the 2 dpa regenerating fin shown in E.


