
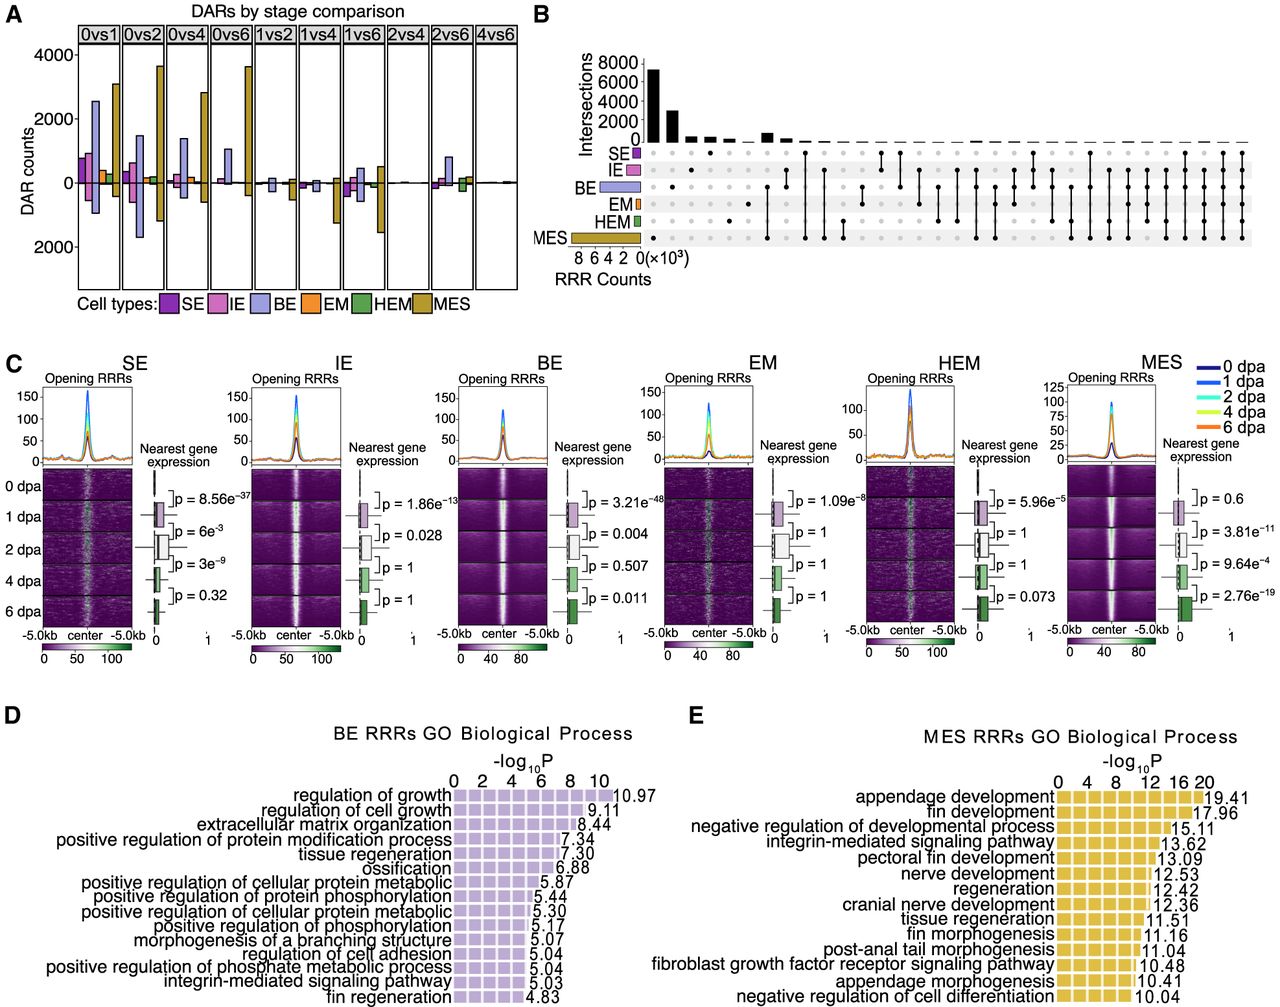
Chromatin regions linked to regenerative and developmental processes show rapid increase of accessibility at early stage of regeneration. (A) Bar graphs display the number of DARs identified between two time points within each cell type during regeneration. Each color represents a different cell type. The stage DARs were identified between any two time points. For example, “0 vs 1” means that the comparison was between 0 dpa and 1 dpa, the number of DARs more open at 1 dpa was shown in the bar graph above the x-axis, and the number of DARs more closed at 1 dpa was shown in the bar plot below the x-axis. Similar methodology applies to other pairwise comparisons. (B) An upset plot shows shared and unique stage DARs across major cell types. All stage DARs compared to 0 dpa, referred as regeneration-responsive regions (RRRs), were combined within each cell type to generate this plot. The horizontal bar graph on the left shows the number of unique stage DARs in each cell type, and the vertical bar graph represents the number of overlapped stage DARs in each category. (C) Aggregated snATAC-seq signals by time point over 5 kb flanking regions centered on opening RRRs of each cell type. Smoothed average signals for each stage are plotted at the top of each heatmap group, with the lines colored by stage. Box plots on the right of each heatmap represent the log2 fold change of expression levels of genes nearest to RRRs across time points, measured across different time points compared with 0 dpa. The P-values were calculated using a Wilcoxon rank-sum test for each two time points. (D,E) Enrichment analysis using the tool GREAT identified processes associated with RRRs in BE cells and MES cells, respectively.


