
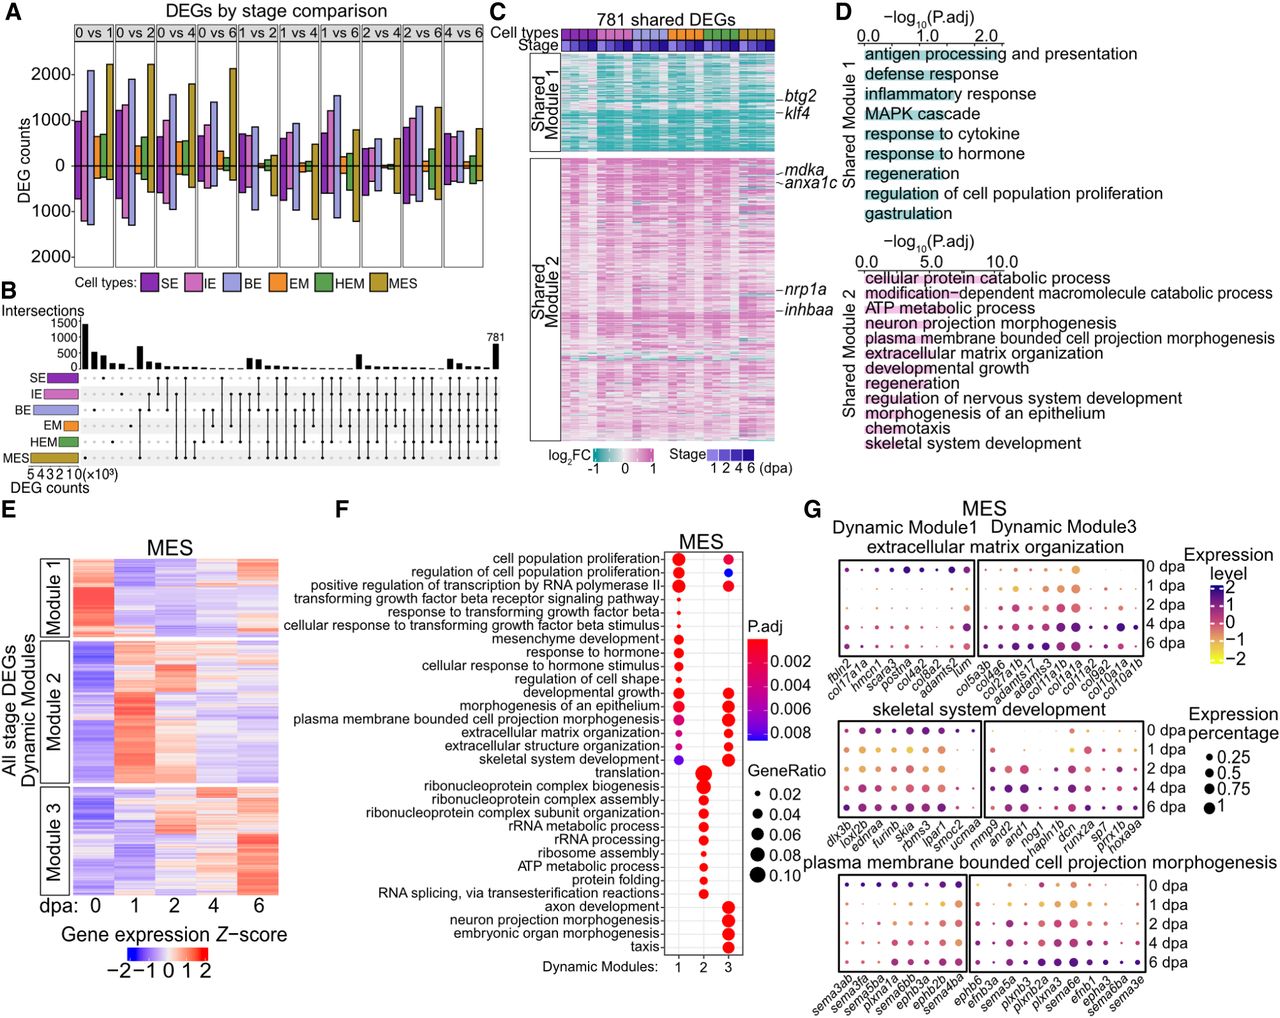
Common and cell-type-specific gene expression programs during fin regeneration. (A) Bar graphs showing the number of DEGs across stages comparisons within each cell type. Colors indicate cell types. The stage DEGs were identified between two stages. For example, “0 vs 1” means that the comparison was between 0 dpa and 1 dpa. Bars above and below the x-axis represent the number of upregulated and downregulated DEGs at 1 dpa, respectively. Similar methodology applies to other pairwise comparisons. (B) An upset plot illustrating unique and shared stage-DEGs among cell types. Stage DEGs identified within a cell type were pooled. The horizontal bar graph on the left shows the number of unique DEGs per cell type. The vertical bar graph on the top indicates the number of overlapped genes in each category. (C) A heatmap displaying log2 fold changes compared with 0 dpa of cell-type-shared DEGs, which were clustered into two modules via k-means clustering. Representative genes involved in cell proliferation and regeneration were highlighted. (D) Top GO terms enriched in each shared module in C. (E) Heatmaps showing scaled expression of all stage DEGs identified within MES, with genes clustered into three dynamic modules. Heatmaps of the other major cell types are in Supplemental Figure S2A. (F) Top 10 GO terms enriched in each dynamic modules identified in MES (E). (G) Dot plots of scaled gene expression across stages in MES showing selected genes identified from GO terms shared in MES dynamic module 1 and dynamic module 3. The GO terms are labeled on the top of each group, with dynamic module 1 genes on the left and dynamic module 3 genes on the right. Dot size indicates the percentage of cells expressing a specific gene, and dot color represents the scaled expression level.


