
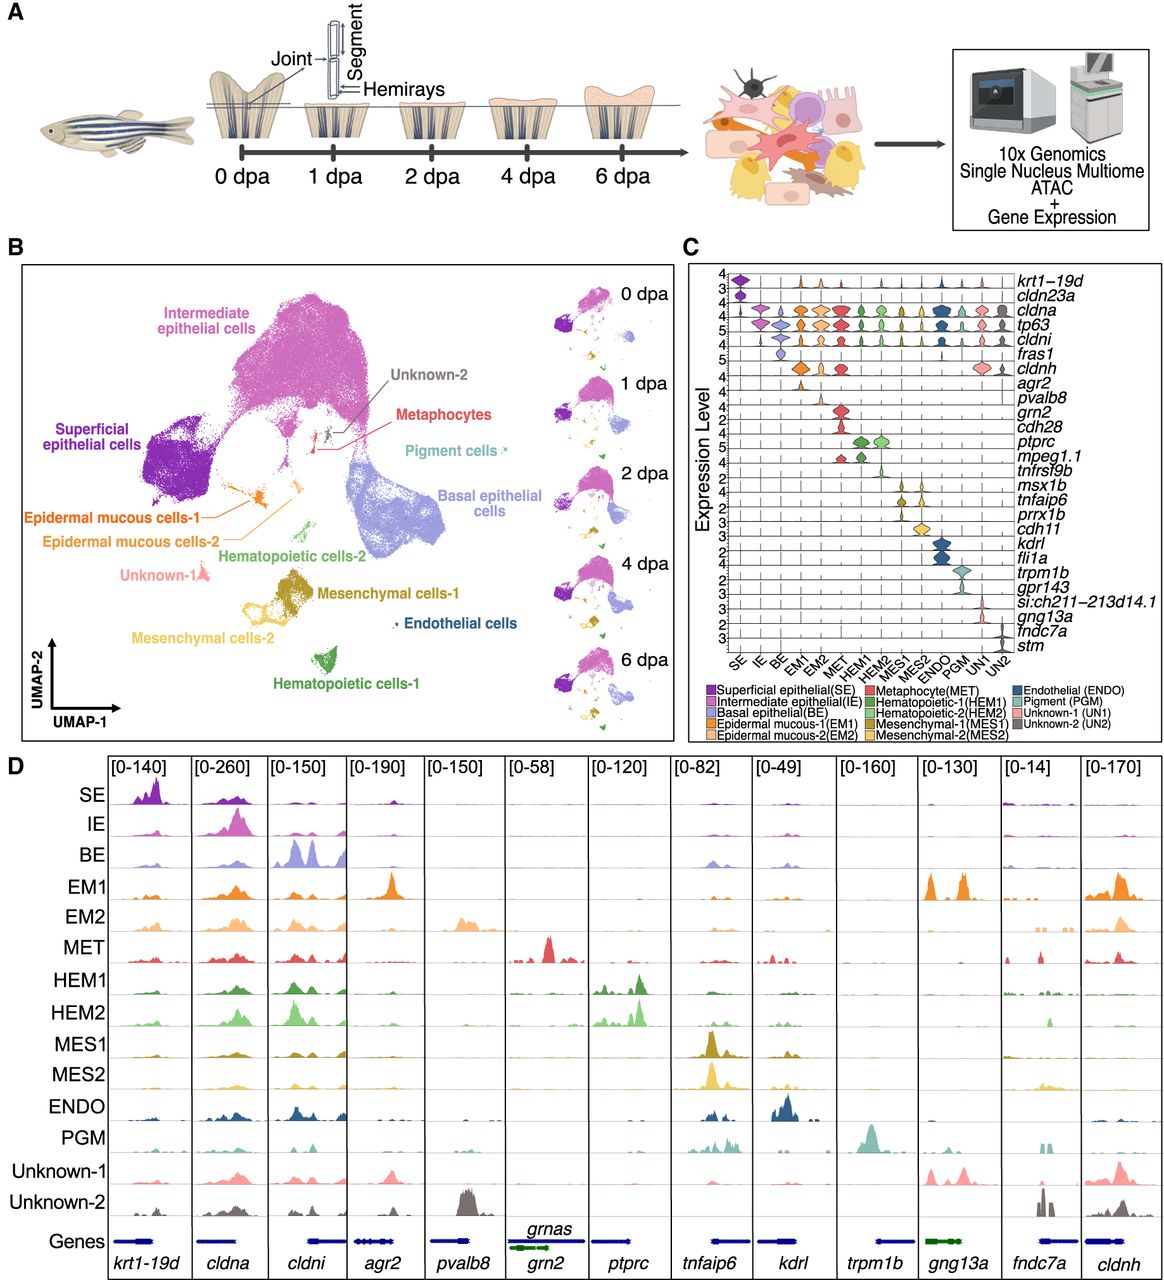
Cell-type identification in regenerating zebrafish caudal fins. (A) General experimental design. Collection of zebrafish caudal fin tissues was conducted at preinjury and 1, 2, 4, and 6 dpa for subsequent library preparation and sequencing. For all samples, we first amputated the distal half of the caudal fin. For the 0 dpa samples, we collected the first two segments of the fin rays immediately after amputation. For the 1, 2, 4, and 6 dpa samples, we collected the regenerated caudal fin tissue. This experimental workflow was partially created using bioRender (https://www.biorender.com/). (B) After quality control, cells were visualized using weighted nearest neighbor (WNN) uniform manifold approximation and projection (UMAP). (Left) Cells colored by cell types; (right) UMAPs separated by time points and colored by cell types. (C) Marker gene expression. Violin plots of log-normalized RNA expression of cell-type marker genes, with colors representing different cell types. (SE) Superficial epithelial, (IE) intermediate epithelial, (BE) basal epithelial, (EM) epidermal mucous, (MET) metaphocyte, (HEM) hematopoietic, (MES) mesenchymal, (ENDO) endothelial, (PGM) pigment, (UN1) unknown-1, (UN2) unknown-2. (D) Genome browser views showing the aggregated and normalized snATAC-seq signals at promoter regions (±1 kb from transcription start site) of selected cell-type marker genes. Tracks are colored with the same color code as in B and C.


