
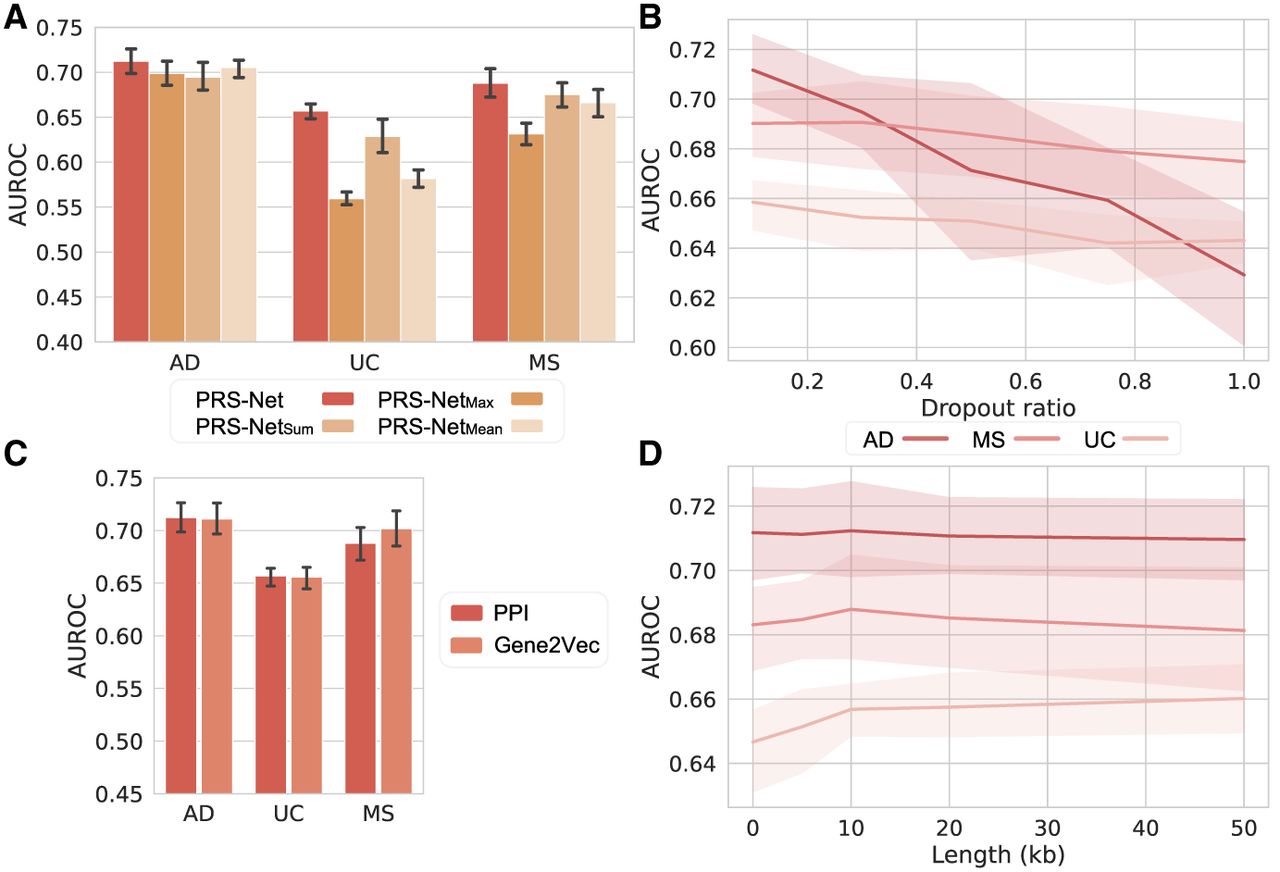
Figure 7.
The ablation results for PRS-Net. (A) The performance comparison between PRS-Net and its multiple variations. The bar plot and error bar denote the mean and standard error, respectively. (B) The performance of PRS-Net with PPI dropout. The line plot and shaded area denote the mean and standard error, respectively. (C) Comparison results of PRS-Net with different GGI networks. (D) The prediction performance of PRS-Net with different extension lengths. (AD) Alzheimer’s disease, (MS) multiple sclerosis, (UC) ulcerative colitis, (AUROC) the area under the receiver operating characteristic curve, (PPI) protein–protein interaction.


