
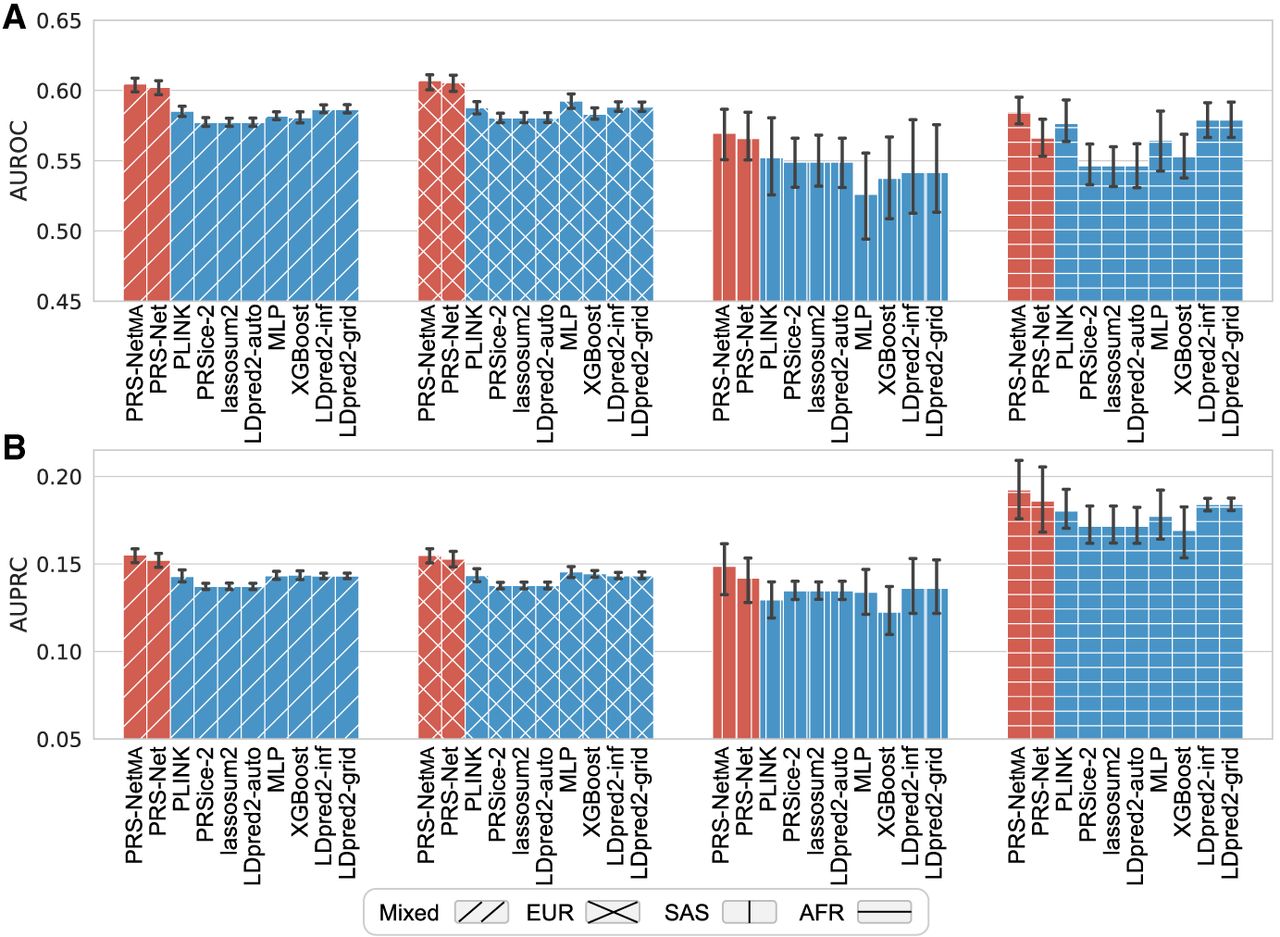
Figure 5.
Prediction performance evaluation for asthma across multiple populations, including Western European (EUR), South Asian (SAS), and African (AFR) ancestries, measured by the area under receiver operating characteristic curve (AUROC; A) and the area under precision-recall curve (AUPRC; B), respectively. The results on the mixed ancestry test set were also reported. The bar plot and error bar denote the mean and standard error, respectively. The training, validation, and testing procedure was conducted for six repeats.


