
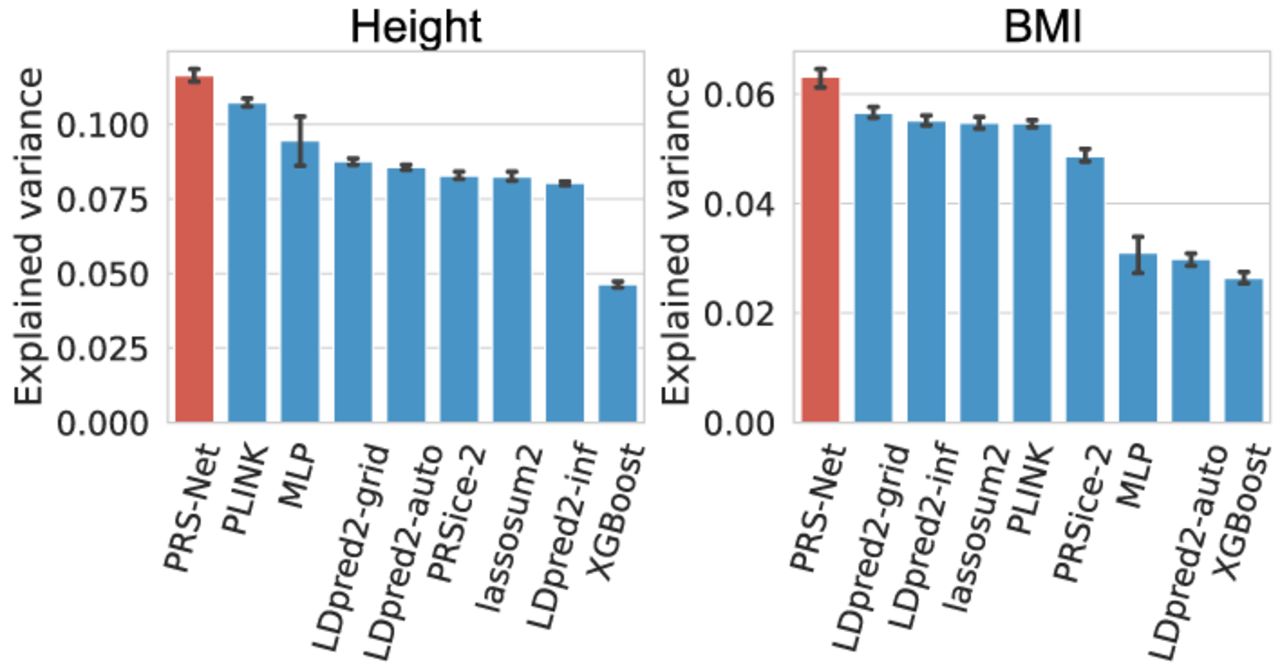
Figure 4.
Prediction performance evaluation for quantitative traits (41,028 and 40,411 test samples for height and body mass index [BMI], respectively). Performance was measured in explained variance. The bar plot and error bar denote the mean and standard error, respectively. The training, validation, and testing procedure was conducted for six repeats with different random seeds for each model and each trait.


